02 - Arrays, Lists, Dictionaries#
Arrays are very helpful in data processing and numerical computations. In this notebook, we will learn how to create arrays, access elements, and perform operations on them.
Creating Arrays#
There are many different different ways to create arrays in Python. Using lists is one common way. The most useful way is with arange or linspace functions from the numpy library.
Array from a List#
import numpy as np
#First create a list
alist = [1,4,8,16,32,64,128,256,512,1024]
aarray = np.array(alist)
print(f'My array is {aarray} and the type is {type(aarray)}')
My array is [ 1 4 8 16 32 64 128 256 512 1024] and the type is <class 'numpy.ndarray'>
Array from Numpy (linspace and arange)#
You will use these properties often as you program in python. Particularly when plotting data, you will often want to create an array of x-values to plot against. np.linspace generates an array of evenly spaced values between two endpoints and a given number of points, while np.arange generates an array of values between two endpoints with a specified step size.
#Using linspace
barray = np.linspace(0,10.3,5) #5 numbers between 0 and 10 with the first number at 0 and the last number at 10.3
carray = np.arange(0,10.3,2) #2 is the step size between 0 and 10 with the first number at 0 and the last number at 10
print(f'The np.linspace array is {barray}')
print(f'The np.arange array is {carray}')
The np.linspace array is [ 0.     2.575  5.15   7.725 10.3  ]
The np.arange array is [ 0.  2.  4.  6.  8. 10.]
Note the differences between the outcome of the two above methods. You’ll have opportunities to use both.
Array Properties#
#find the shape of the array, the number of elements in the array, and its dimension (1D, 2D, 3D, etc.)
print(f'The shape of the aarray is {aarray.shape}')
#generate a two-dimensional array
darray = np.array([[1,2,3],[4,5,6],[7,8,9]])
print(f'The two-dimensional darray is {darray.shape}')
The shape of the aarray is (10,)
The two-dimensional darray is (3, 3)
#the size of the array
print(f'The size of the aarray is {aarray.size}') #basically the number of elements in the array
print(f'The size of the darray is {darray.size}')
The size of the aarray is 10
The size of the darray is 9
#resize the array
print(f'The original aarray is {aarray}')
aarray.resize(2,5)
print(f'The resized aarray is {aarray}')
The original aarray is [   1    4    8   16   32   64  128  256  512 1024]
The resized aarray is [[   1    4    8   16   32]
 [  64  128  256  512 1024]]
Array Indexing#
aarray = np.linspace(0,10,10) #how many items does this array have?
print(f'The array is {np.round(aarray,3)} and has {aarray.size} items')
print(f'The 1st item in the array is {aarray[0]}')
print(f'The 4th item in the array is {aarray[3]}')
The array is [ 0.     1.111  2.222  3.333  4.444  5.556  6.667  7.778  8.889 10.   ] and has 10 items
The 1st item in the array is 0.0
The 4th item in the array is 3.3333333333333335
#print the first four items in the array
print(f'The first four items in the array are {np.round(aarray[0:4],2)}')
The first four items in the array are [0. 1.11 2.22 3.33]
#first resize the array and then print just the second column
aarray.resize(2,5)
print(f'The resized aarray is np.round({aarray},2)')
print(f'The second column in the array is {aarray[:,1]}')
The resized aarray is np.round([[ 0.          1.11111111  2.22222222  3.33333333  4.44444444]
 [ 5.55555556  6.66666667  7.77777778  8.88888889 10.        ]],2)
The second column in the array is [1.11111111 6.66666667]
Array Concatenation#
#join two arrays
aarray = np.array([1,2,3])
barray = np.array([4,5,6])
carray = np.concatenate((aarray,barray))
print(f'The concatenated array is {carray}')
The concatenated array is [1 2 3 4 5 6]
Element-wise Operations#
Addition#
#add elements of two arrays
aarray + barray
array([5, 7, 9])
aarray + carray
---------------------------------------------------------------------------
ValueError                                Traceback (most recent call last)
Cell In[12], line 1
----> 1 aarray + carray

ValueError: operands could not be broadcast together with shapes (3,) (6,)
Multiplication and Division#
aarray/barray
array([0.25, 0.4 , 0.5 ])
aarray*barray
array([ 4, 10, 18])
Aggregation Functions#
print(f'aarray is {aarray}, barray is {barray}, and carray is {carray}')
aarray is [1 2 3], barray is [4 5 6], and carray is [1 2 3 4 5 6]
np.sum(aarray), np.sum(barray), np.sum(carray)
(6, 15, 21)
np.median(aarray), np.median(barray), np.median(carray)
(2.0, 5.0, 3.5)
np.min(aarray), np.min(barray), np.min(carray)
(1, 4, 1)
Linear Algebra#
Dot Product#
#dot product of two arrays
np.dot(aarray,barray)
32
Matrix Inverse#
or
rewriten in matrix form: A = \(\begin{bmatrix} 1 & -2 & -3 \\ 1 & -5 & -6 \\ 1 & -2 & -2 \end{bmatrix}\) x = \(\begin{bmatrix} y \\ x_1 \\ x_2 \end{bmatrix}\) B = \(\begin{bmatrix} 4 \\ 7 \\ 1 \end{bmatrix}\) $\( A \cdot x = B \)\( \)\( x = A^{-1} \cdot B \)$
matrix = np.array([[1,-2,-3], [1,-5,-6], [1,-2,-2]])
np.dot(np.linalg.inv(matrix),np.array([4,7,1]))
array([-1., 2., -3.])
Determinant#
Helpful for calculating the inverse of a matrix. Non-zero determinant means the matrix is invertible.
print(f'The determinant is {np.linalg.det(matrix):.2f}')
The determinant is -3.00
Sorting#
tlist = ['guava','banana','cherry','apple','orange']
np.sort(tlist)
array(['apple', 'banana', 'cherry', 'guava', 'orange'], dtype='<U6')
narray = np.array([3.2,2,1,4.9,3.9,4.5,3.8,9.2,8.1,7.3])
np.sort(narray)
array([1. , 2. , 3.2, 3.8, 3.9, 4.5, 4.9, 7.3, 8.1, 9.2])
Searching#
np.where(narray < 4)
(array([0, 1, 2, 4, 6]),)
np.argmax(narray)
7
Random Numbers#
np.random.rand(3,3)
array([[0.91521063, 0.48135773, 0.06571234],
       [0.41043224, 0.44457302, 0.5196756 ],
       [0.92572997, 0.92863534, 0.57064225]])
np.linalg.inv(np.random.rand(3,3))
array([[ 1.72112568,  0.44327839, -1.80440612],
       [-1.70505788,  0.95179143,  1.57608789],
       [-0.09349699, -0.37732573,  1.16485401]])
np.random.randint(1,10,size=(1,4)) #random integers between 1 and 9 with 1 row and 4 columns
array([[1, 8, 3, 9]])
Dictionaries#
Dictionary is a collection of key:value pairs. It is similar to a list, but you can access the values by the key instead of the index. Here is an example:
adictionary = {'a':1,'b':2,'c':3} #create a dictionary
print(adictionary['a']) #access the value associated with the key 'a'
#or
print(adictionary.get('a')) #access the value associated with the key 'a'
1
1
Another way of thinking about dictionaries is as a spreadsheet. The keys are the column headers and the values are the data in the columns. You can access the data by the column header instead of the row and column index.
spreadsheet = {'time':np.linspace(0,1,100),'temperature':np.random.rand(100)*20+20,'pressure':np.random.rand(100)*10+10}
spreadsheet
{'time': array([0.        , 0.01010101, 0.02020202, 0.03030303, 0.04040404,
        0.05050505, 0.06060606, 0.07070707, 0.08080808, 0.09090909,
        0.1010101 , 0.11111111, 0.12121212, 0.13131313, 0.14141414,
        0.15151515, 0.16161616, 0.17171717, 0.18181818, 0.19191919,
        0.2020202 , 0.21212121, 0.22222222, 0.23232323, 0.24242424,
        0.25252525, 0.26262626, 0.27272727, 0.28282828, 0.29292929,
        0.3030303 , 0.31313131, 0.32323232, 0.33333333, 0.34343434,
        0.35353535, 0.36363636, 0.37373737, 0.38383838, 0.39393939,
        0.4040404 , 0.41414141, 0.42424242, 0.43434343, 0.44444444,
        0.45454545, 0.46464646, 0.47474747, 0.48484848, 0.49494949,
        0.50505051, 0.51515152, 0.52525253, 0.53535354, 0.54545455,
        0.55555556, 0.56565657, 0.57575758, 0.58585859, 0.5959596 ,
        0.60606061, 0.61616162, 0.62626263, 0.63636364, 0.64646465,
        0.65656566, 0.66666667, 0.67676768, 0.68686869, 0.6969697 ,
        0.70707071, 0.71717172, 0.72727273, 0.73737374, 0.74747475,
        0.75757576, 0.76767677, 0.77777778, 0.78787879, 0.7979798 ,
        0.80808081, 0.81818182, 0.82828283, 0.83838384, 0.84848485,
        0.85858586, 0.86868687, 0.87878788, 0.88888889, 0.8989899 ,
        0.90909091, 0.91919192, 0.92929293, 0.93939394, 0.94949495,
        0.95959596, 0.96969697, 0.97979798, 0.98989899, 1.        ]),
 'temperature': array([28.95848948, 38.69748229, 37.90422984, 30.32264826, 31.05849856,
        22.35124123, 28.97251272, 30.09882827, 20.66076318, 35.99523492,
        31.69085565, 21.80772223, 26.00800843, 31.41871614, 23.56019535,
        28.23723434, 24.28152814, 29.00428179, 33.57300128, 22.86331582,
        32.64917997, 28.26434395, 31.60418788, 25.6647239 , 28.65849265,
        26.85161462, 38.37828212, 33.55877719, 25.9662997 , 32.39210286,
        21.10898214, 38.22325847, 34.56722762, 23.64170702, 23.89687995,
        30.43989649, 30.3286403 , 25.56597993, 20.04759147, 27.34166648,
        30.80463953, 22.83812348, 25.40891609, 34.11583838, 20.72889745,
        22.42224334, 32.80653773, 37.14079325, 32.46997585, 32.09020707,
        21.36615118, 31.23128996, 33.76409621, 23.14673018, 24.76196186,
        22.85239978, 29.74053766, 24.89203634, 25.81766602, 36.51919182,
        27.10220992, 28.5347821 , 23.53440492, 21.98462149, 26.39083302,
        31.13955428, 23.18708924, 21.16010461, 26.74358188, 21.67986682,
        27.42692584, 22.30079418, 21.2812363 , 36.98568634, 31.88154306,
        25.19976625, 38.1342961 , 24.9038835 , 34.98665435, 22.3311538 ,
        39.0598547 , 23.05220078, 21.22746562, 34.54825509, 36.86203998,
        24.62064266, 35.12833015, 38.87363632, 36.54428982, 20.88804169,
        39.01041402, 25.86396561, 31.36332727, 20.92752007, 38.59398917,
        20.30996   , 35.71774852, 21.4994731 , 20.03950239, 33.42768086]),
 'pressure': array([13.32462738, 12.47882126, 12.82568274, 19.48626995, 19.64323792,
        10.7154736 , 13.12284751, 15.19280285, 17.12225957, 10.96413956,
        18.20256182, 15.85072125, 18.04907623, 15.66582544, 15.00135823,
        14.99095191, 15.69589688, 16.81014155, 18.09604666, 13.46830142,
        17.18987006, 19.82559687, 19.42271032, 11.8653222 , 13.33229984,
        16.70736967, 14.75403444, 15.54044361, 13.05464635, 10.38134909,
        17.05067929, 18.83890461, 13.76903047, 11.36807352, 17.90873382,
        16.08213094, 16.33718612, 17.17691405, 10.69942646, 18.95491242,
        16.55087525, 18.35690804, 19.00778379, 10.1427753 , 19.22578239,
        16.0467838 , 10.04056061, 17.00017808, 18.1530278 , 17.79973482,
        12.50202831, 10.83799385, 11.20113796, 11.6751409 , 18.38583965,
        11.7524547 , 15.14060946, 11.61566708, 15.21006578, 19.67829671,
        13.18198414, 18.01461846, 19.5368536 , 11.41021421, 11.32777376,
        15.50011405, 10.78664733, 11.18334697, 13.5857463 , 12.62509407,
        11.25191512, 17.81277548, 17.07834309, 17.39948359, 19.60759118,
        13.30864187, 10.67973517, 15.18845077, 10.31506568, 17.0732346 ,
        11.88211701, 13.03361402, 11.03586356, 15.98372052, 14.70374746,
        13.84592671, 15.37625159, 11.06361796, 16.64905931, 19.57102384,
        12.40912803, 12.80455937, 12.58478357, 12.59957538, 13.40651477,
        14.64604168, 19.67300838, 15.56063898, 17.19683423, 12.6482983 ])}
Data Science#
Python is used extensively with data science. The pandas library is a powerful tool for data manipulation and analysis. It is built on top of numpy and matplotlib.
import pandas as pd
df = pd.DataFrame(spreadsheet)
df.head()
| time | temperature | pressure | |
|---|---|---|---|
| 0 | 0.000000 | 28.958489 | 13.324627 |
| 1 | 0.010101 | 38.697482 | 12.478821 |
| 2 | 0.020202 | 37.904230 | 12.825683 |
| 3 | 0.030303 | 30.322648 | 19.486270 |
| 4 | 0.040404 | 31.058499 | 19.643238 |
#generate a third column based on the values in the first two columns
df['density'] = df['pressure']*1e4/(df['temperature']+273)*0.04
df.head()
| time | temperature | pressure | density | |
|---|---|---|---|---|
| 0 | 0.000000 | 28.958489 | 13.324627 | 17.650939 |
| 1 | 0.010101 | 38.697482 | 12.478821 | 16.014016 |
| 2 | 0.020202 | 37.904230 | 12.825683 | 16.501136 |
| 3 | 0.030303 | 30.322648 | 19.486270 | 25.697085 |
| 4 | 0.040404 | 31.058499 | 19.643238 | 25.841393 |
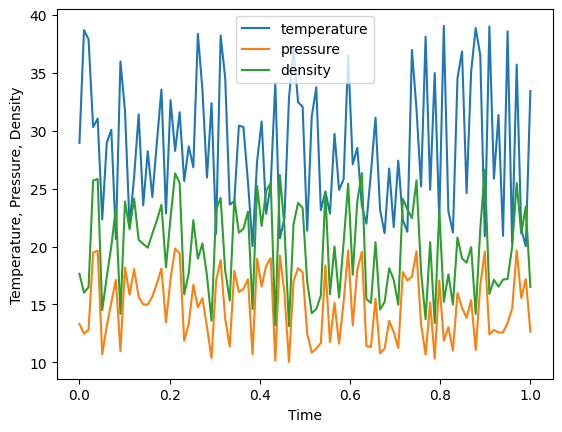
#plot the data
plt = df.plot(x='time',y=['temperature','pressure','density'])
plt.set_ylabel('Temperature, Pressure, Density')
plt.set_xlabel('Time')
Text(0.5, 0, 'Time')