19-Flammability 2#
Download lecture freeform here: clint-bg/safetyinjc
Python Flammability Diagram#
Below code submitted by Isaac Matthews, 2024.
Requirements for the equalateral flammability diagram below: #pip install matplotlib, python-ternary; the below code wont work if you install ternary,
import matplotlib.pyplot as plt
import ternary
from scipy.optimize import fsolve
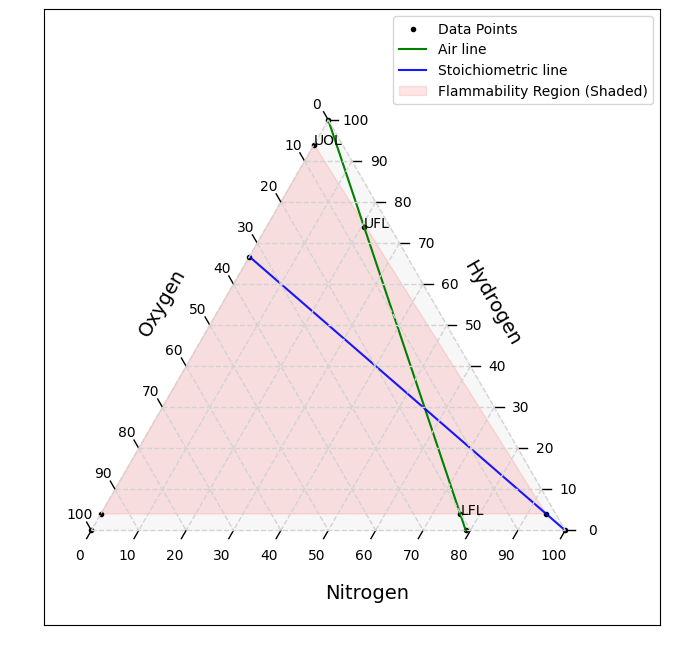
ufl = 74
lfl = 4
stoic = 66.7 #stoichiometric ratio for hydrogen in oxygen
loc = 2
def flammabilityTriangle(name,lfl, ufl, stoic,loc,figsize = (10, 8)):
# The stoic value is the stoichiometric ratio of fuel in pure oxygen
lfl_o = (100-lfl)*0.21; ufl_o = (100-ufl)*0.21
lfl_n = 100 - lfl - lfl_o; ufl_n = 100 - ufl - ufl_o
slope = 1/(100/stoic-1) # z/y or ratio of fuel to oxygen at stoichiometric mixture
def eq(vars):
x, y = vars #x is n2, y is o2
denom = x+y*(1+slope)
eq1 = loc/100 - y/(denom)
eq2 = loc/100 + x/denom + y*slope/denom - 1
return eq1, eq2
mol_n2, mol_o2 = fsolve(eq, (0.5, 0.5)); mol_f = slope*mol_o2
loc_f = mol_f/(mol_n2+mol_o2+mol_f)*100
uol = ufl*(100+1.87*(100-ufl_o))/(ufl_o+ufl*(1+1.87)) #upper flammability limit in pure oxygen
lol = lfl
data = [
#nitrogen fuel oxygen
[0, 0, 100], # Pure Oxygen 0
[79, 0, 21], # Pure Air 1
[0, 100, 0], # Pure Fuel 2
[100,0,0], # pure n2 3
[lfl_n, lfl, lfl_o], #LFL 4
[ufl_n,ufl,ufl_o], #UFL 5
[0,uol,100-uol], #upper loc 6 (uol)
[0,stoic,100-stoic], #left most stoic point 7
[100-loc-loc_f, loc_f,loc],#intersection 8 (actual loc at stoichiometric point)
[0,lol,100-lol], #lol 9
# Add more data points as needed
]
# Create a larger figure
whole = plt.figure(figsize=figsize)
box = whole.subplots()
# Create a ternary plot
fig, tax = ternary.figure(ax = box, scale=100)
#fix what terniary messes up
box.set_ylim(-20,110)
box.set_xlim(-10,120)
box.set_aspect(1)
box.tick_params(axis='both', which='both', length=0,labelcolor = 'white') #if you can't beat them join them
tax.ticks(axis='lbr', linewidth=1, multiple=10, offset=0.02, clockwise=False)
# Plot data points
tax.scatter(data, marker='.', color='k', label='Data Points')
# Add a line between pure fuel and pure air
tax.line(data[2], data[1], color='green', linestyle='-',label = "Air line")
#tax.line(data[9], data[8], color='red', alpha=0.6, linestyle='--', label = "Flammability region")
tax.line(data[3], data[7], color='blue', alpha=0.9, linestyle='-', label = "Stoichiometric line")
#tax.line(data[6], data[8], color='red', alpha=0.6, linestyle='--')
# --- Corrected part for shading (hopefully for good this time!) ---
# Define the vertices of the flammability region in ternary coordinates
flammability_vertices_ternary = [data[9], data[8], data[6]]
# Convert ternary coordinates to Cartesian (x, y) coordinates for matplotlib's fill
flammability_vertices_cartesian = ternary.helpers.project_sequence(flammability_vertices_ternary)
# Use the underlying matplotlib axes (box) to fill the region
box.fill(
flammability_vertices_cartesian[0], # X coordinates
flammability_vertices_cartesian[1], # Y coordinates
color='red',
alpha=0.1,
label="Flammability Region (Shaded)"
)
# --- End of corrected part ---
# Customize the plot
#tax.set_title(f"Flammability Triangle for {name} in Air", fontsize=16)
tax.left_axis_label("Oxygen", fontsize=14, offset=0.1)
tax.right_axis_label(name, fontsize=14, offset=0.02)
tax.bottom_axis_label("Nitrogen", fontsize=14, offset=-.1)
tax.gridlines(color="lightgrey", multiple=10, linewidth=1, linestyle='--')
# Define labels for data points
labels = ["", "", "","","LFL","UFL","UOL","","",""]
# Add labels for data points
for i, point in enumerate(data):
tax.annotate(labels[i], position=point, fontsize=10)
# Add legend
tax.legend()
# Show the plot
plt.ticks = False
plt.show()
flammabilityTriangle("Hydrogen", lfl,ufl,stoic,loc)
/Users/clintguymon/opt/anaconda3/envs/jupiterbook/lib/python3.9/site-packages/ternary/plotting.py:148: UserWarning: No data for colormapping provided via 'c'. Parameters 'vmin', 'vmax' will be ignored
  ax.scatter(xs, ys, vmin=vmin, vmax=vmax, **kwargs)