Effective Hazards Analysis Steps
Hazard Identification and Evaluation with Risk Analysis and Assessment
Define the process
This step can involve collecting documentation such as a process flow diagram (PFD), piping and instrumentation diagram (P&ID), operating procedure and other relevant information. It is also important to gather information about the process, such as the materials used, and the operating conditions among other things.
Identify the hazards analysis method to use
Hazards analysis methods include HAZOP, FMEA, and fault tree analysis (FTA). The choice of method will depend on the specific process and the goals of the analysis.
Identify the Hazardous Top Level Event and contributing factors with
a Fault Tree Analysis (FTA)
Including deductive and inductive reasoning
a HAZOP (Hazards and Operability Study)
Including guide words and deviations
Fill out a Hazards Analysis (HA) Table
For each failure mode (the lower level events in your falut tree anlaysis), fill out the hazards analysis table including the following information:
Task description or process step
Hazard type
Hazard description
Event consequence
Safeguards currently present to mitigate the hazard
Rank (1A to 5E) for severity and likelihood of the hazard
Recommendations to reduce the risk of the hazard
Potentially complete a quantitative risk analysis for those hazards with a high risk ranking
Incoporate other PSM elements per the OSHA 1910.119 standard
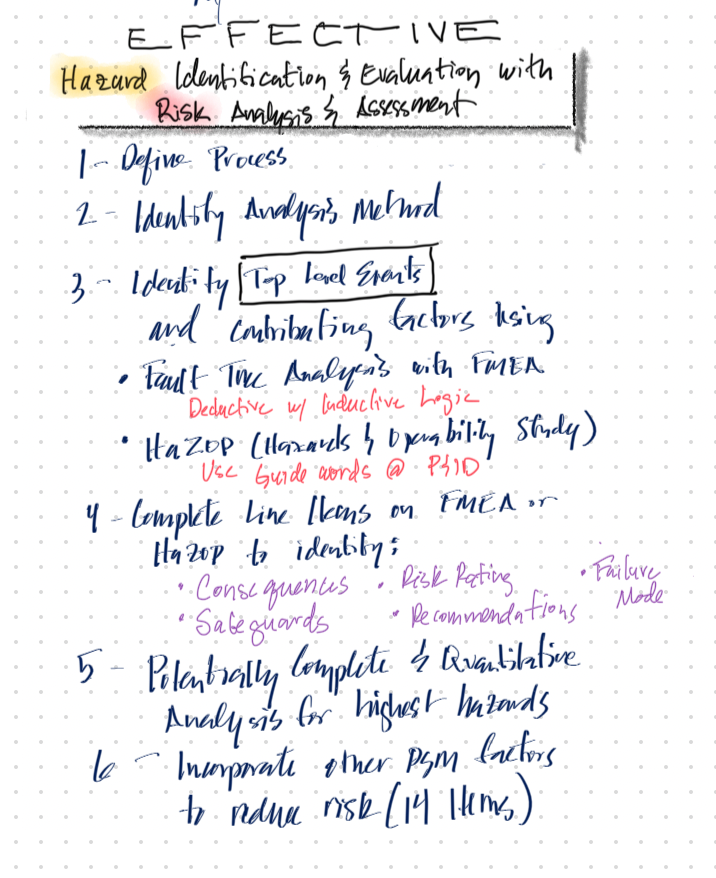
Figure 1:Effective Hazards Analysis Steps
Hazards Analysis Methods
Some of the possible methods that can be used include:
Checklists
What If
Five (5) Why’s
Fishbone
Bowtie
JHA (Job Hazard Analysis)
HAZOP (Hazard and Operability Study)
FTA (Fault Tree Analysis)
FMEA (Failure Mode and Effects Analysis)
Bowtie
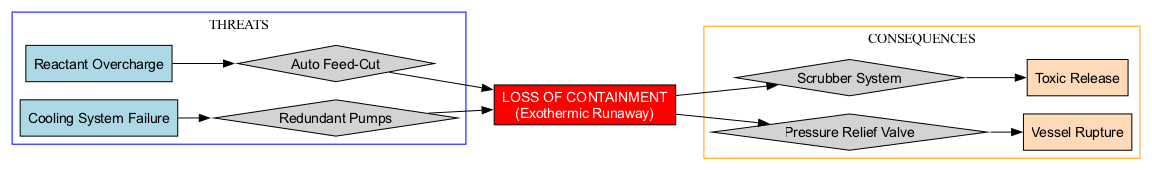
Figure 2:Bowtie Example
Click to See Code
import graphviz

# Create a new directed graph
dot = graphviz.Digraph('Bowtie', comment='Process Safety Bowtie', format='png')
dot.attr(rankdir='LR', size='12,5')

# Define Styles
dot.attr('node', shape='box', style='filled', fontname='Arial')

# --- THE CENTER (Top Event) ---
dot.node('TopEvent', 'LOSS OF CONTAINMENT\n(Exothermic Runaway)',
         fillcolor='red', fontcolor='white', width='2.5')

# --- LEFT SIDE (Threats & Preventative Barriers) ---
with dot.subgraph(name='cluster_threats') as t:
    t.attr(label='THREATS', color='blue')
    t.node('T1', 'Cooling System Failure', fillcolor='lightblue')
    t.node('T2', 'Reactant Overcharge', fillcolor='lightblue')

    t.node('B1', 'Redundant Pumps', shape='diamond', fillcolor='lightgray')
    t.node('B2', 'Auto Feed-Cut', shape='diamond', fillcolor='lightgray')

# --- RIGHT SIDE (Consequences & Mitigative Barriers) ---
with dot.subgraph(name='cluster_consequences') as c:
    c.attr(label='CONSEQUENCES', color='orange')
    c.node('C1', 'Vessel Rupture', fillcolor='peachpuff')
    c.node('C2', 'Toxic Release', fillcolor='peachpuff')

    c.node('M1', 'Pressure Relief Valve', shape='diamond', fillcolor='lightgray')
    c.node('M2', 'Scrubber System', shape='diamond', fillcolor='lightgray')

# --- CONNECTIONS ---
# Left to Center
dot.edge('T1', 'B1')
dot.edge('B1', 'TopEvent')
dot.edge('T2', 'B2')
dot.edge('B2', 'TopEvent')

# Center to Right
dot.edge('TopEvent', 'M1')
dot.edge('M1', 'C1')
dot.edge('TopEvent', 'M2')
dot.edge('M2', 'C2')

# Render the diagram
dot.render('reactor_bowtie', view=True)
print("Bowtie diagram generated as 'reactor_bowtie.png'")
Fishbone and Five (5) Why
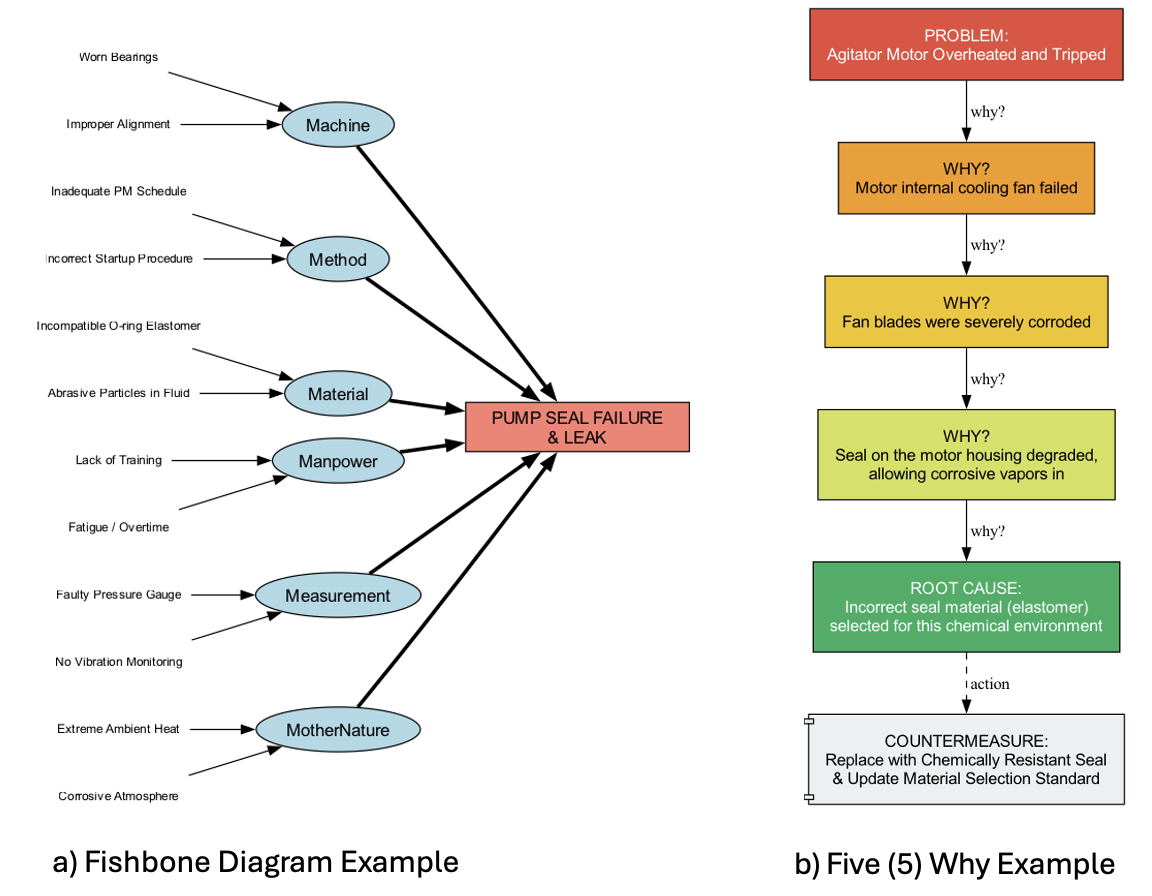
Figure 3:Fishbone and Five Why Example
Click to See Code
# Create a directed graph for the Fishbone Diagram Example
fish = graphviz.Digraph('Fishbone', comment='Root Cause Analysis', format='png')
fish.attr(rankdir='LR', size='12,8')

# Define Global Styles
fish.attr('node', fontname='Arial', style='filled')

# --- THE HEAD (The Effect/Problem) ---
fish.node('Effect', 'PUMP SEAL FAILURE\n& LEAK',
          shape='deeppink', fillcolor='salmon', width='2.5')

# --- THE MAIN BONES (Categories: The 6 Ms) ---
categories = {
    'Machine': ['Worn Bearings', 'Improper Alignment'],
    'Method': ['Inadequate PM Schedule', 'Incorrect Startup Procedure'],
    'Material': ['Incompatible O-ring Elastomer', 'Abrasive Particles in Fluid'],
    'Manpower': ['Lack of Training', 'Fatigue / Overtime'],
    'Measurement': ['Faulty Pressure Gauge', 'No Vibration Monitoring'],
    'MotherNature': ['Extreme Ambient Heat', 'Corrosive Atmosphere']
}

# --- BUILDING THE STRUCTURE ---
for cat, causes in categories.items():
    # Create the category node (the large bones)
    fish.node(cat, cat, shape='ellipse', fillcolor='lightblue')
    fish.edge(cat, 'Effect', penwidth='3') # Thick line for main bones

    # Create the individual causes (the small bones)
    for cause in causes:
        fish.node(cause, cause, shape='none', style='none', fontsize='10')
        fish.edge(cause, cat)

# Render the diagram
fish.render('pump_fishbone', view=True)
print("Fishbone diagram generated as 'pump_fishbone.png'")

# Create a directed graph for the 5 Whys analysis
five_whys = graphviz.Digraph('FiveWhys', comment='Root Cause Analysis', format='png')
five_whys.attr(rankdir='TB', size='8,10') # Top to Bottom flow

# Define Node Styles
five_whys.attr('node', fontname='Arial', style='filled', shape='box', margin='0.2')

# --- THE STAGES ---

# 1. The Problem Statement
five_whys.node('Problem', 'PROBLEM:\nAgitator Motor Overheated and Tripped',
               fillcolor='#e74c3c', fontcolor='white')

# 2. Why 1
five_whys.node('Why1', 'WHY?\nMotor internal cooling fan failed',
               fillcolor='#f39c12')

# 3. Why 2
five_whys.node('Why2', 'WHY?\nFan blades were severely corroded',
               fillcolor='#f1c40f')

# 4. Why 3
five_whys.node('Why3', 'WHY?\nSeal on the motor housing degraded,\nallowing corrosive vapors in',
               fillcolor='#d4e157')

# 5. Why 4 (The Root Cause)
five_whys.node('RootCause', 'ROOT CAUSE:\nIncorrect seal material (elastomer)\nselected for this chemical environment',
               fillcolor='#27ae60', fontcolor='white')

# 6. Countermeasure
five_whys.node('CM', 'COUNTERMEASURE:\nReplace with Chemically Resistant Seal\n& Update Material Selection Standard',
               shape='component', fillcolor='#ecf0f1')

# --- THE CONNECTIONS ---
five_whys.edge('Problem', 'Why1', label=' why?')
five_whys.edge('Why1', 'Why2', label=' why?')
five_whys.edge('Why2', 'Why3', label=' why?')
five_whys.edge('Why3', 'RootCause', label=' why?')
five_whys.edge('RootCause', 'CM', style='dashed', label=' action')

# Render the diagram
five_whys.render('5_whys_analysis', view=True)
print("5 Whys diagram generated as '5_whys_analysis.png'")
Recommended Methods
The recommended methods for hazards analysis that we used effectively in evaluating explosive, pyrotechnic, and propellant based processes included:
Fault Tree Analysis (FTA) with deductive and inductive reasoning followed by Failure Mode and Effects Analysis (FMEA) where the HA table is filled out for each failure mode.
HAZOP (Hazards and Operability Study) with guide words and deviations
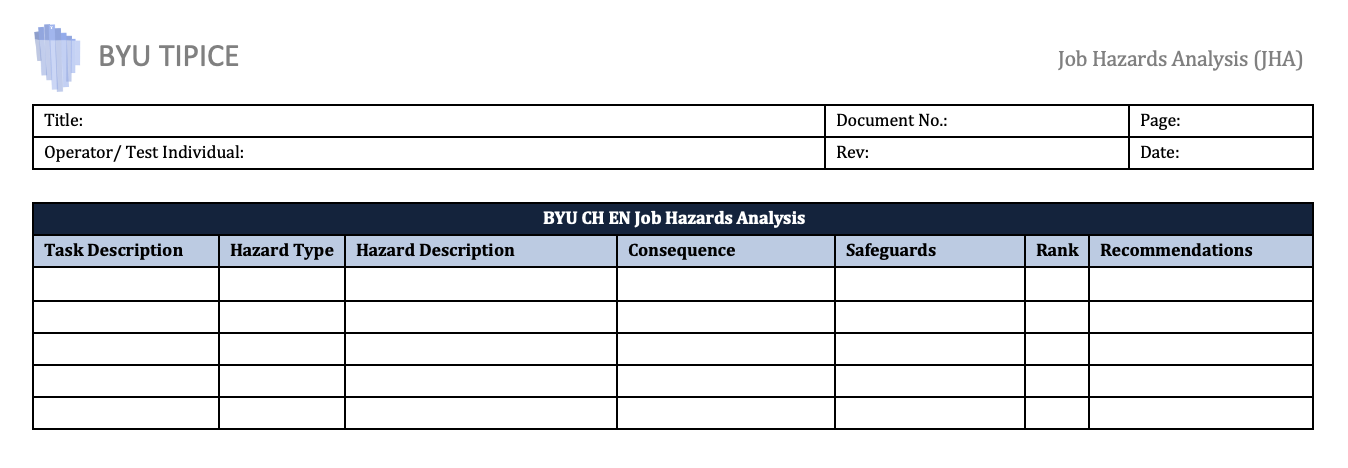
Figure 4:JHA Template
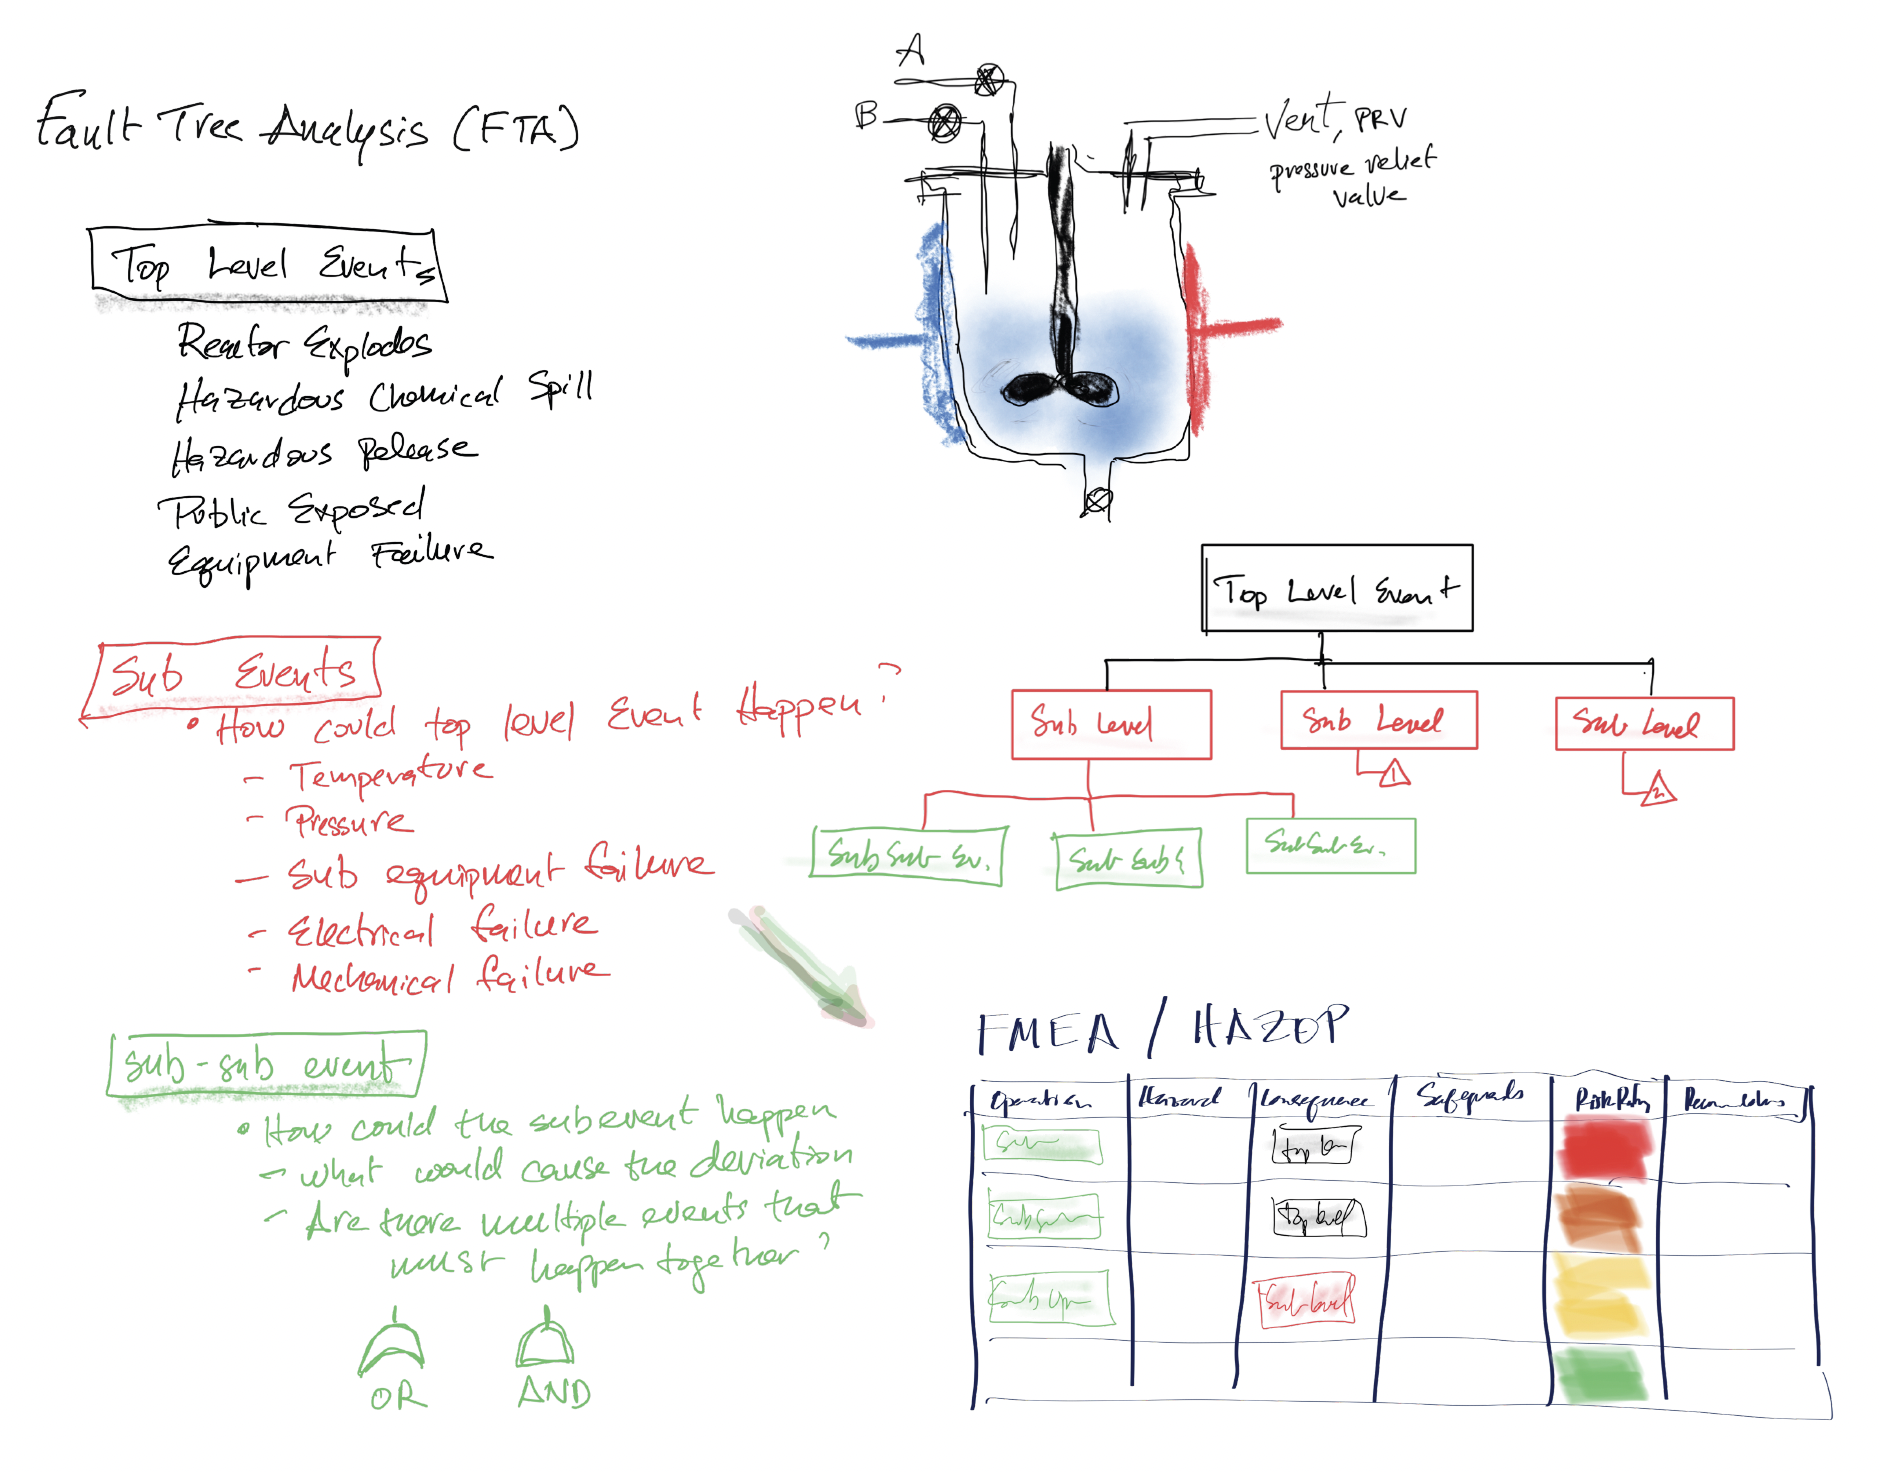
Figure 5:Fault Tree Analysis to Hazards Analysis Table
When Should you Conduct a Hazards Analysis? As early in the process as feasible.
Many complex processes have been designed and built prior to completion of a hazards anlysis (FTA with a FMEA, or HAZOP). This makes integration of engineering controls into the process very difficult or costly or both. Ideally you complete a hazards anlysis at the design stage and other stages including:
Design (a Design Hazards Analysis)
Construction and Startup
Operation
Decomissioning
Accident Investigation
Process Safety Information (PSI) is Critical
Process safety information including details of the process, the materials used, and the operating conditions is critical to completing a hazards analysis. We’ll talk a lot more about PSI.
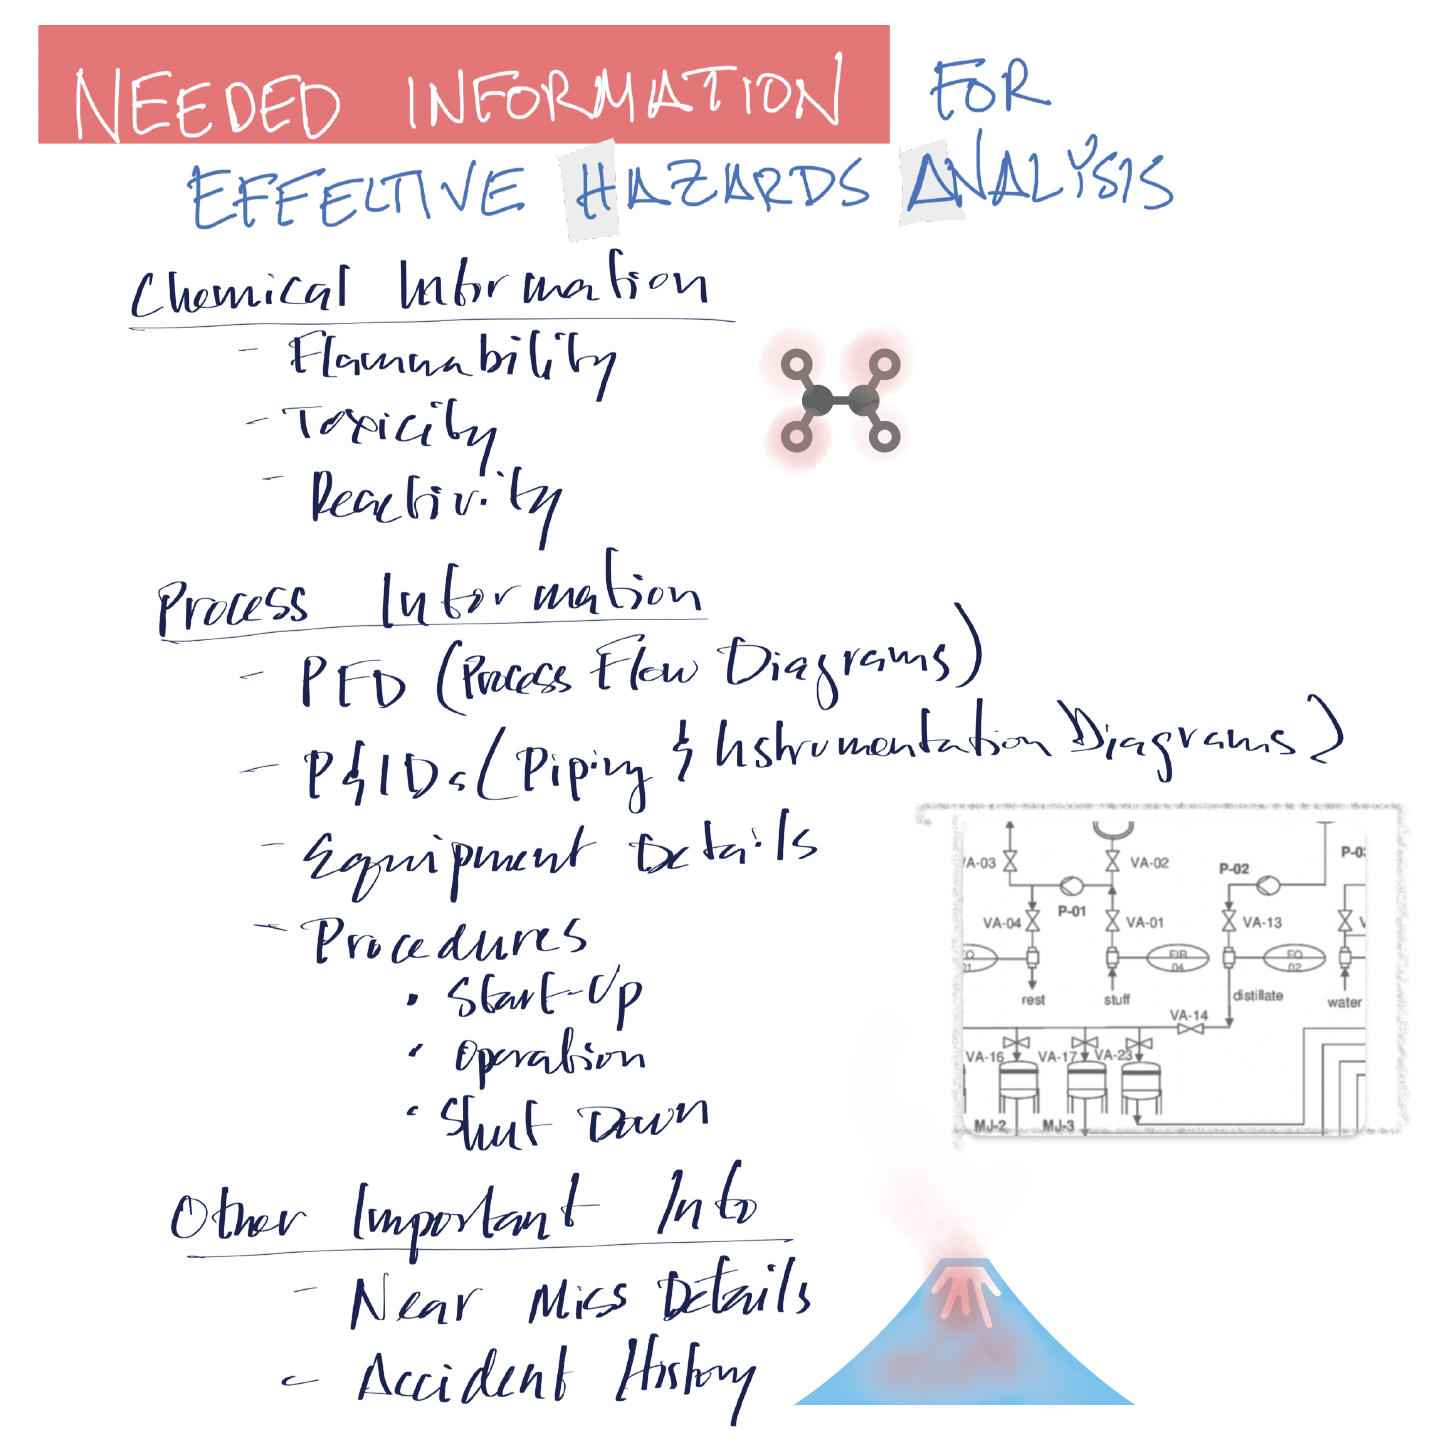
Figure 6:Needed Information for Effective Hazards Analysis