Industrial Hygienists
Industrial hygienists are typically part of the safety and health team in a company. They are responsible for identifying, evaluating, and controlling workplace hazards together with workers and management.
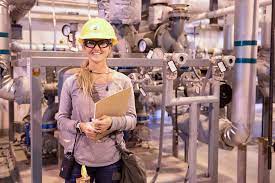
Figure 1:Picture of an Industrial Hygienist in a Chemical Plant https://
The four steps of industrial hygiene are:
Anticipation: Identifying potential hazards before they occur.
Recognition: Identifying hazards that are present.
Evaluation: Determining the magnitude of the exposure and the response.
Control: Implementing measures to control the hazards.
Common Tools used by Industrial Hygienists
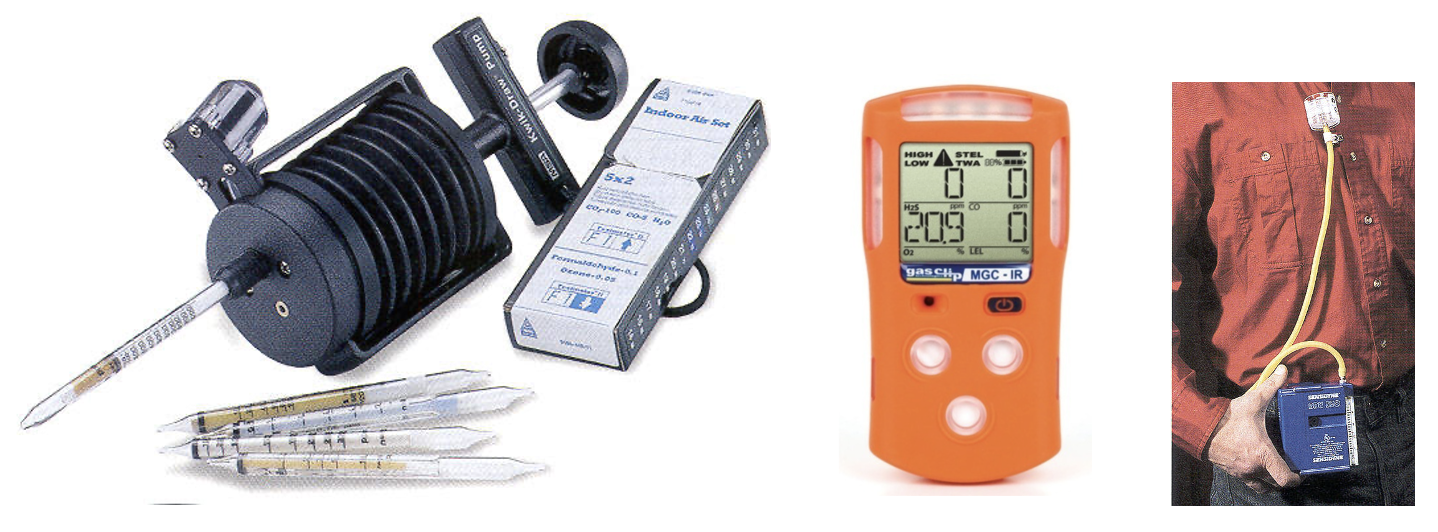
Figure 2:Industrial Hygiene Tools
Quantifying Exposures
TWA, time-weighted average, is the most common way to quantify exposures. It is the exposure averaged over an 8-hour workday.
Gases and Vapors
where is the concentration of the chemical at time and is the time the concentration is present.
Example Concentration Profile
| Time (hours) | Concentration (ppm) |
|---|---|
| 0 | 0 |
| 1 | 10 |
| 2 | 15 |
| 5 | 18 |
| 6 | 20 |
| 8 | 10 |
| 9 | 30 |
| 10 | 40 |
import numpy as np
import matplotlib.pyplot as plt
import pandas as pd
#example discrete concentration profile
data = {'time (hr)': [0, 1, 2, 5, 6, 8, 9, 10],
'concentration (ppm)': [0,10,15,18,20,10,30,40]}
df = pd.DataFrame(data)
df.plot(x='time (hr)', y='concentration (ppm)', kind = 'bar')
plt.show()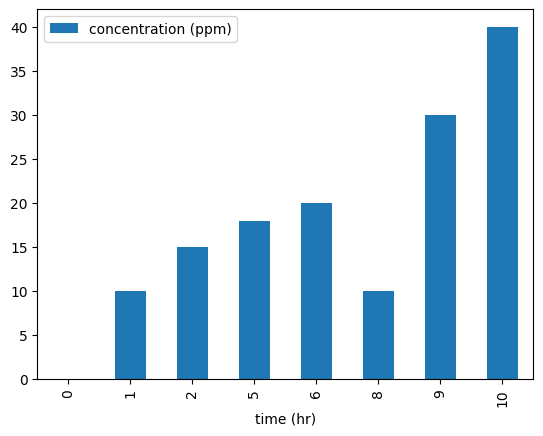
#TWA Calculation; Method 1 (assume the current measure is the same for the previous interval)
TWA_1 = 0; ti_1 = 0;
#loop through each time interval
for i in range(1, len(df)):
    #calculate TWA for each interval
    C_i = df['concentration (ppm)'][i]
    t_i = df['time (hr)'][i]
    TWA_1 += C_i*(t_i-ti_1)
    ti_1 = t_i;
print(f'TWA_1 = {TWA_1/8:.1f} ppm')
TWA_1 = 23.6 ppm
#TWA Calculation; Method 2 (use the trapezoidal rule)
TWA_trap = 0;
#loop through each time interval
for i in range(1, len(df)):
    #calculate TWA for each interval
    C_i = df['concentration (ppm)'][i]
    C_i_1 = df['concentration (ppm)'][i-1]
    t_i = df['time (hr)'][i]
    t_i_1 = df['time (hr)'][i-1]
    TWA_trap += (C_i+C_i_1)*(t_i-t_i_1)/2
print(f'TWA_trap = {TWA_trap/8:.1f} ppm')
TWA_trap = 21.4 ppm
#TWA Calculation; Method 3 (fit a polynomial to the data and integrate with cspline1d_integral)
from scipy.interpolate import CubicSpline
#fit a polynomial to the data
cs = CubicSpline(df['time (hr)'], df['concentration (ppm)'])
#integrate the polynomial with quad
from scipy.integrate import quad
TWA_CSpline, err = quad(cs, 0, 10)
print(f'TWA_CSpline = {TWA_CSpline/8:.1f} ppm')
TWA_CSpline = 21.1 ppm
#fit a polynomial to the data
p = np.polyfit(df['time (hr)'], df['concentration (ppm)'], 3)
#integrate the polynomial
TWA_poly = quad(np.poly1d(p), 0, 10)[0]
print(f'TWA_poly = {TWA_poly/8:.1f} ppm')
TWA_poly = 22.1 ppm
#plot the data and the polynomial fit
t = np.linspace(0, 10, 100)
C = np.poly1d(p)(t)
plt.plot(t, cs(t), label='cubic spline')
plt.plot(t, C, label = 'polynomial fit')
plt.bar(df['time (hr)'], df['concentration (ppm)'], label = 'data')
plt.xlabel('time (hr)')
plt.ylabel('concentration (ppm)')
plt.legend()
plt.show()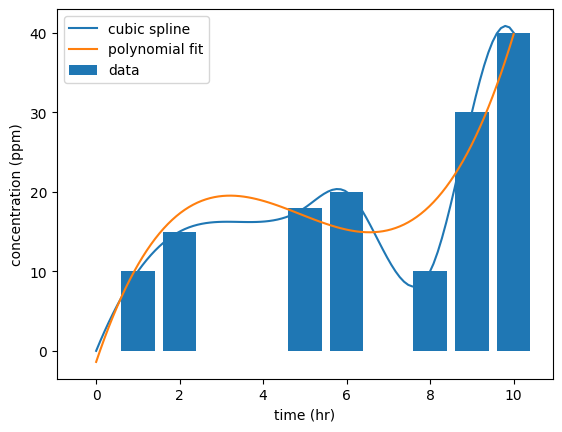
#tabular display of the results
print('Method\tTWA (ppm)')
print(f'1\t\t{TWA_1/8:.1f}')
print(f'trapezoid\t{TWA_trap/8:.1f}')
print(f'CSpline\t\t{TWA_CSpline/8:.1f}')
print(f'Polynomial_3\t{TWA_poly/8:.1f}')
Method TWA (ppm)
1 23.6
trapezoid 21.4
CSpline 21.1
Polynomial_3 22.1
Was the worker over exposed?
If the TLV-TWA is 20 ppm for the above chemical, then YES, the worker was over exposed.
Multiple Gaseous Chemicals
What if there are multiple hazardous vapors present?
Overexposure can be determined by the below equation:
The TLV-TWA for gaseous mixtures can be found by:
Dusts
Dusts are treated the same way but instead of using ppm, mg/m^3 is used.