This section provides an overview of human body systems and toxicology, which are essential for understanding how injuries occur. It covers the major body systems, some of their functions, and how they can be affected by chemical exposures.
Major Human Body Systems
nervous system
The nervous system consists of the brain, spinal cord, and nerves. It controls and coordinates body activities. Damage to the nervous system can lead to loss of sensation, paralysis, or death.
circulatory system
The circulatory system includes the heart, blood vessels (arteries and veins), and blood. It transports oxygen, nutrients, and waste products throughout the body. Damage to this system can result in hemorrhage, shock, or organ failure. Typical blood volume is 5 liters (1.3 gallons). It takes 20 - 60 seconds for a red blood cell (one of 20-30 trillion) to make a full circuit of the body. Starting in the right atrium it then moves to the right ventricle, pulmonary artery, lungs (to pick up oxygen), pulmonary vein, left atrium, left ventricle, aorta, arteries, capillaries (to deliver oxygen), veins, and back to the right atrium.
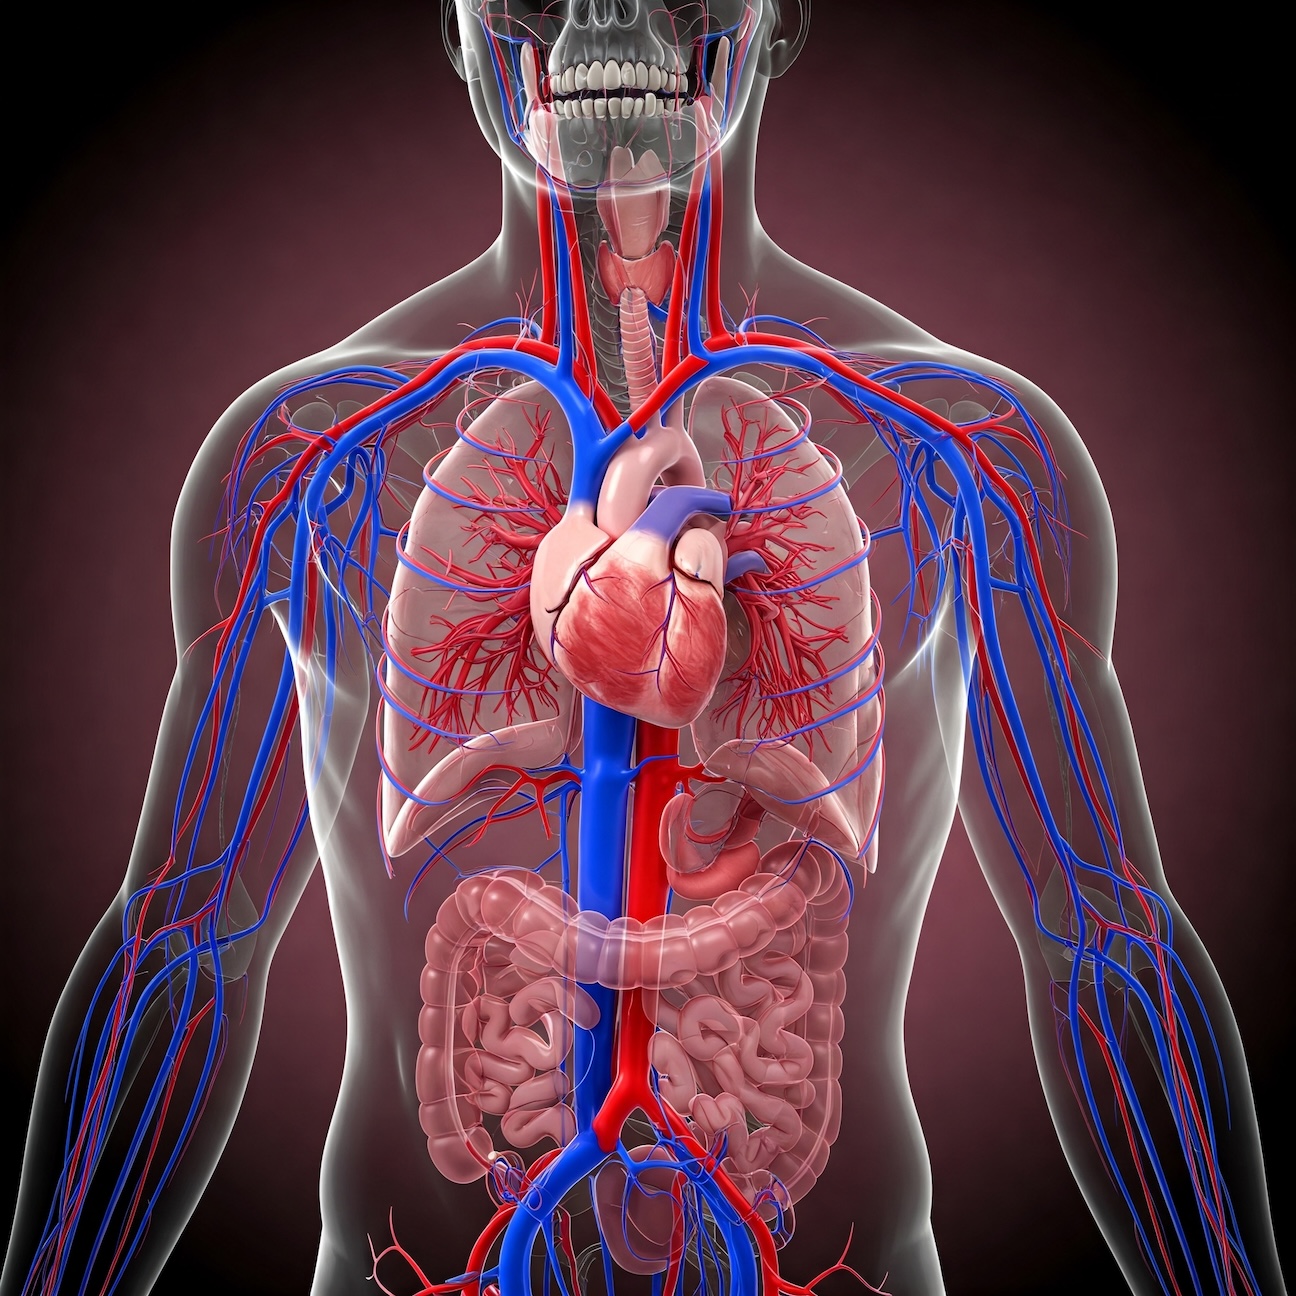
Figure 1:AI generated image of parts of the circulatory, respiratory, and digestive systems.
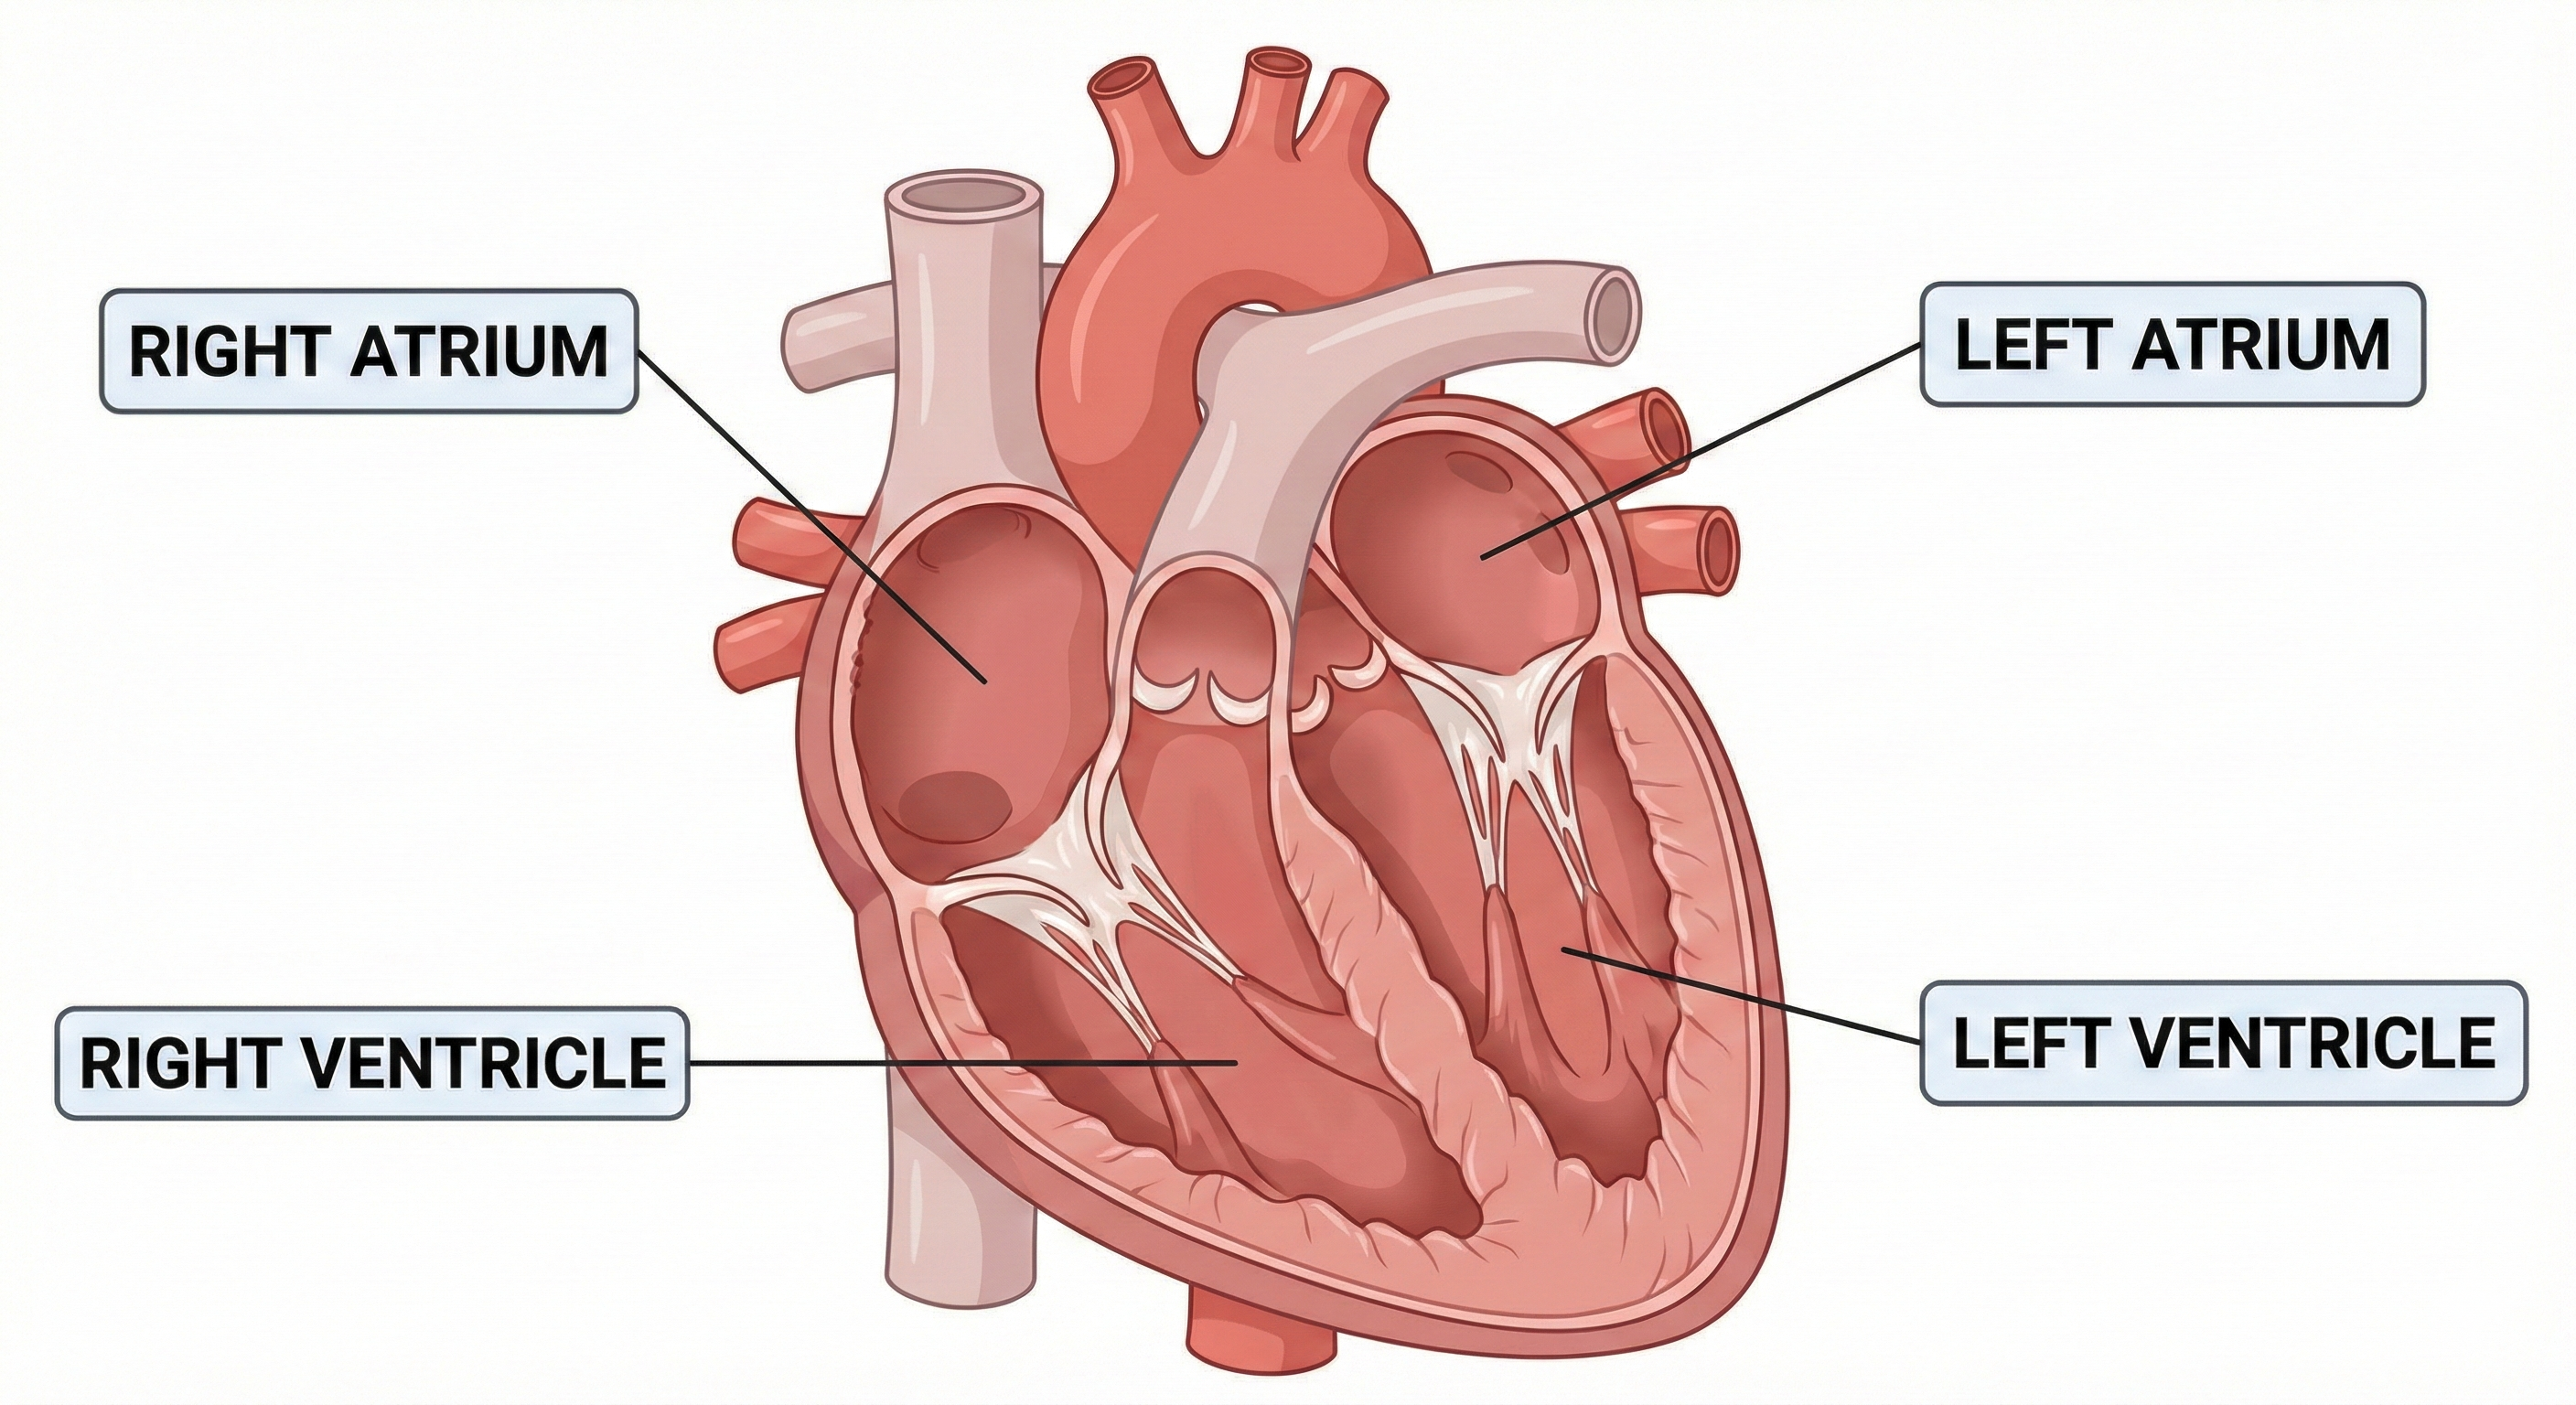
Figure 2:AI generated image of the heart where blood flows through the chambers and valves. Oxygen-deficient blood enters the right atrium from the superior vena cava, moves to the right ventricle, and is pumped to the lungs via the pulmonary artery. Oxygen-rich blood returns to the left atrium, moves to the left ventricle, and is pumped out to the body through the aorta. Heart vessels (not shown) supply the heart muscle with oxygen and nutrients.
skeletal system
The skeletal system is made up of bones, cartilage, and ligaments. It provides structural support, protects internal organs, and facilitates movement. Damage to the skeletal system can lead to fractures, dislocations, or impaired mobility.
muscular system
The muscular system consists of muscles that enable movement and maintain posture. It works in conjunction with the skeletal system. Damage to muscles can result in strains, tears, or loss of function.
digestive system
The digestive system includes the mouth, esophagus, stomach, intestines, liver, and pancreas. It breaks down food into nutrients that the body can absorb. Damage to this system can lead to malnutrition, dehydration, or systemic toxicity.
respiratory system
The respiratory system comprises the lungs, trachea, bronchi, and alveoli. It facilitates the exchange of oxygen and carbon dioxide. Damage to the respiratory system can result in impaired gas exchange, respiratory distress, or failure.
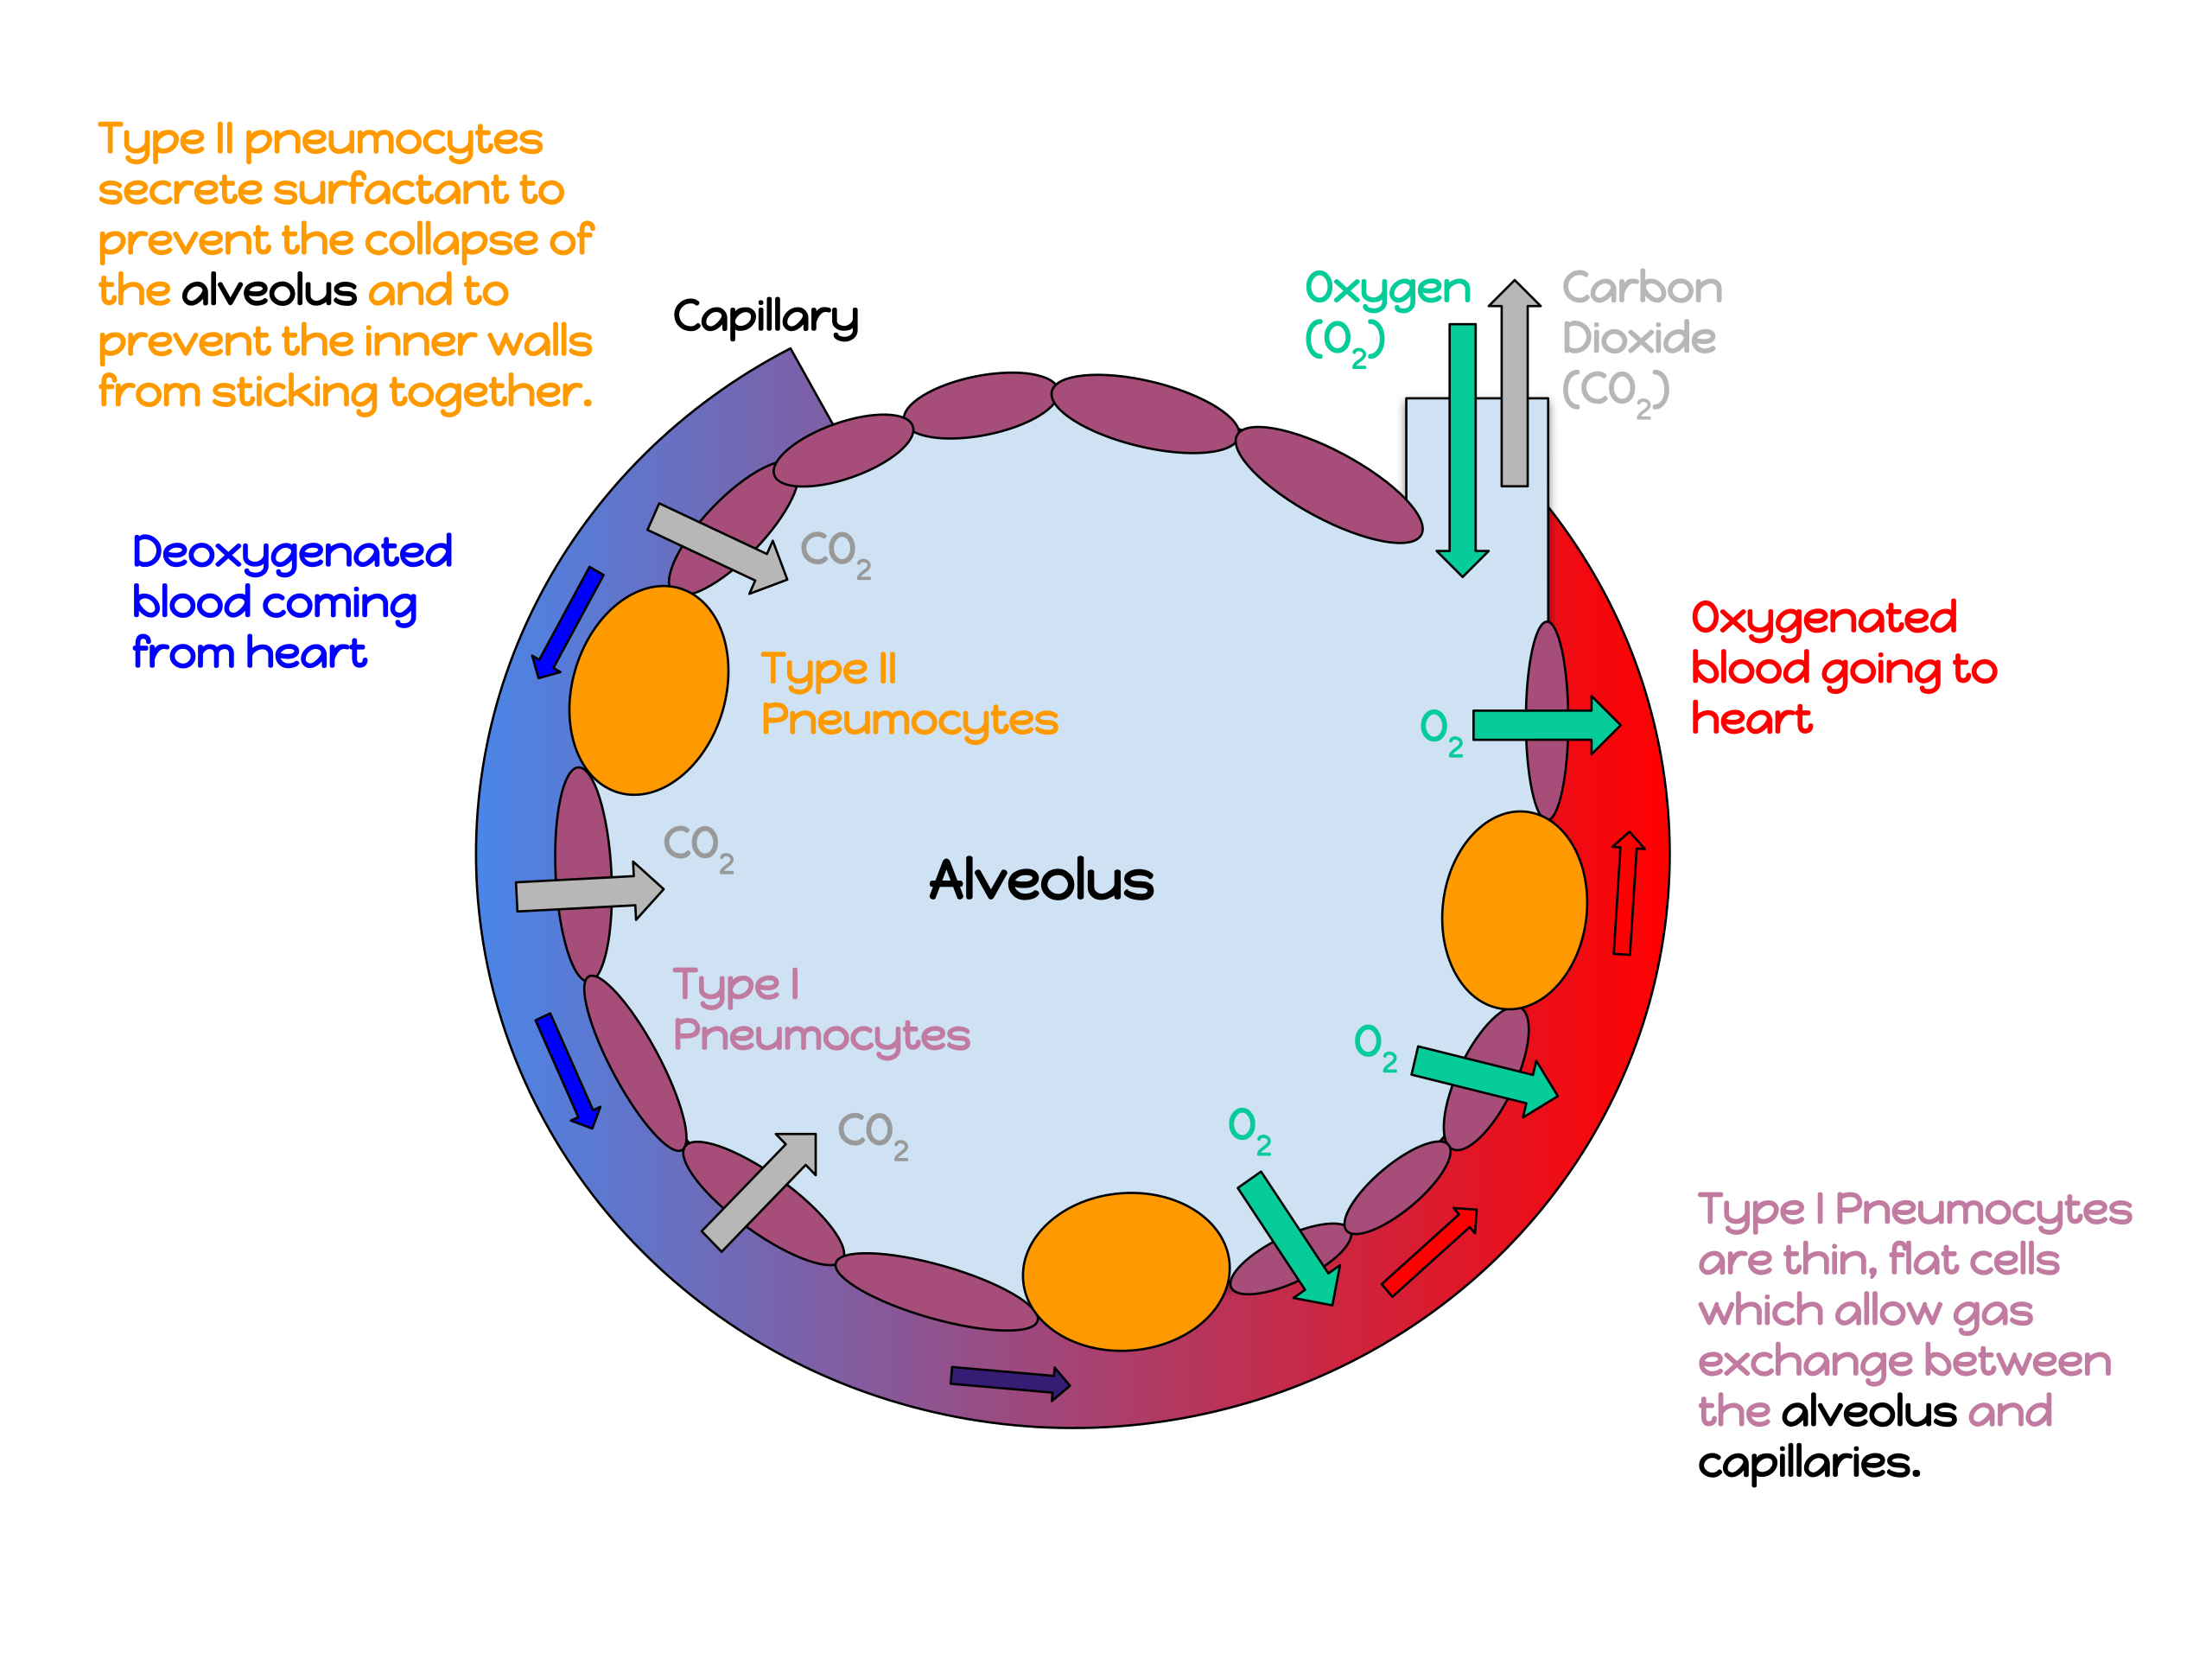
Figure 3:Un adapted image of an alveolus: a 200 micron diameter air sac found in the bronchi of the lungs. Credit to Katherinebutler1331, used per the Creative Commons Attribution-Share Alike 4.0 International license.
Excretory system
The excretory system includes the kidneys, ureters, bladder, and urethra. It removes waste products and excess substances from the bloodstream. Damage to this system can lead to toxin buildup, electrolyte imbalances, or kidney failure.
Endocrine system
The endocrine system consists of glands that produce hormones like the hypothalamus, pituitary, thyroid, and adrenal glands. It regulates various bodily functions such as metabolism, growth, and reproduction. Damage to this system can result in hormonal imbalances and metabolic disorders.
Reproductive system
The reproductive system includes organs such as the ovaries, testes, uterus, and prostate. It is responsible for producing gametes and supporting reproduction. Damage to this system can lead to infertility or hormonal imbalances.
Lymphatic system
The lymphatic system comprises lymph nodes, lymph vessels, and lymph fluid. It helps maintain fluid balance, absorbs fats from the digestive tract, and plays a role in immune function. Damage to this system can result in lymphedema or compromised immunity. There are approximately 600 lymph nodes in the human body with the largest clusters found in the neck, armpits, and groin. There are no lymph nodes in the brain or spinal cord. There is about 3 liters (0.8 gallons) of lymph fluid or about 3 liters drains back into the circulatory system (near the heart) each day.
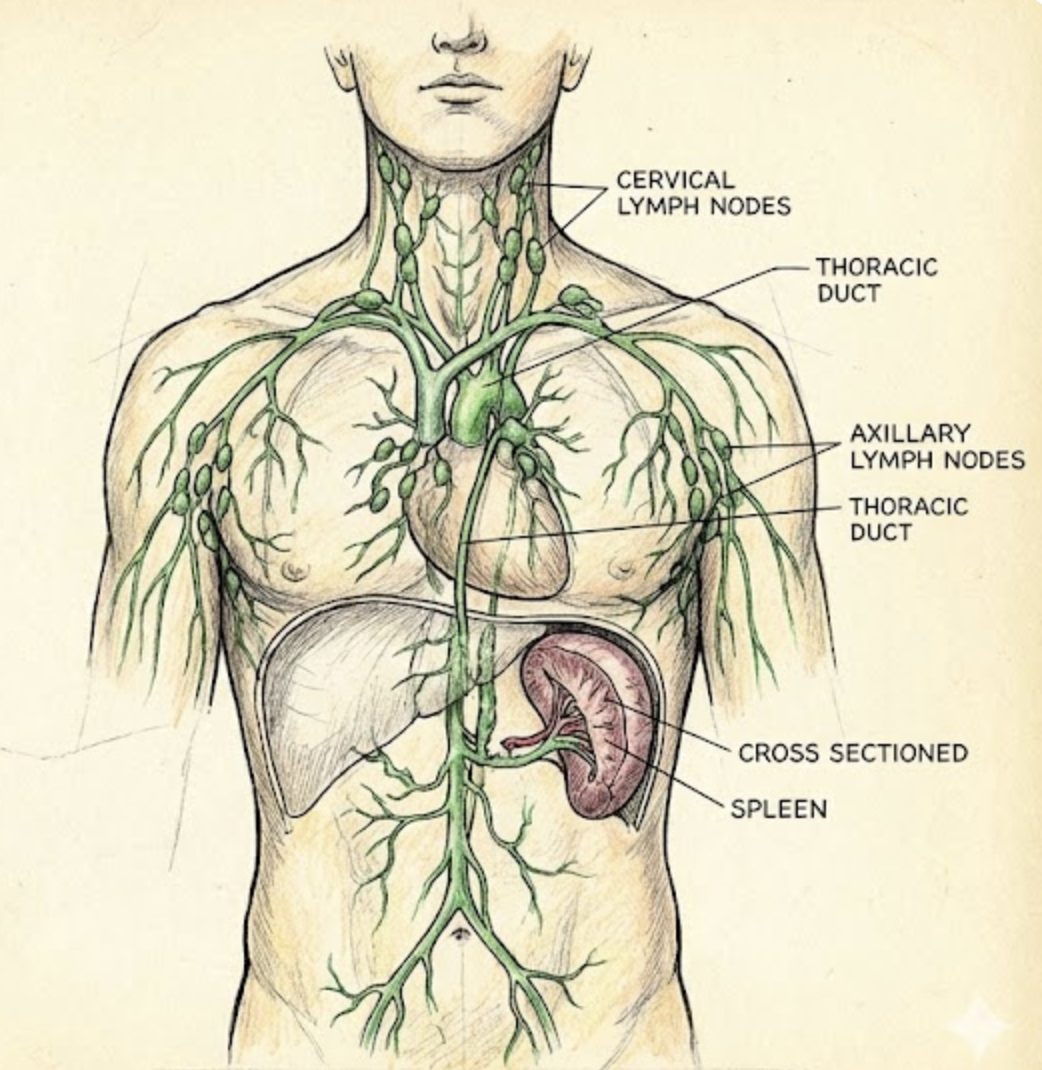
Figure 4:An AI generated drawing of the lymphatic system, showing lymph nodes and vessels.
Integumentary system
The integumentary system includes the skin, auditory and vision sensors, and sweat glands. It protects the body from environmental hazards, regulates temperature, and provides sensory information. Damage to this system can lead to infections, dehydration, or impaired sensation.
Microbiome
The human microbiome consists of trillions of microorganisms (bacteria, viruses (bacteriophages), fungi) that live on and inside the body, particularly in the gut. These microbes play a crucial role in digestion, immune function, and overall health. Disruption of the microbiome can lead to infections, digestive issues, or weakened immunity.
Cell Types and Functions
There are many cell types in the human body including:
stem, red blood, white blood, platelets, skeletal muscle, cardiac muscle, smooth muscle, neuron, neuroglial, endothelial, epithelial, bone, cartilage, fat, fibroblasts, mast, etc.
Some of those cell types with their functions include:
pneumocytes
Pneumocytes are specialized cells in the alveoli of the lungs that facilitate gas exchange. Type I pneumocytes form the structure of the alveolar walls, while Type II pneumocytes produce surfactant, which reduces surface tension and prevents alveolar collapse. Damage to pneumocytes can impair oxygen uptake and lead to respiratory distress.
red blood cells (erythrocytes)
Red blood cells (RBCs) are responsible for transporting oxygen from the lungs to tissues and carbon dioxide from tissues back to the lungs. They contain hemoglobin, a protein that binds oxygen. Damage to RBCs can lead to anemia, reduced oxygen delivery, and fatigue.
neurons
Neurons are the primary cells of the nervous system that transmit electrical signals. They consist of a cell body, dendrites, and an axon. Neurons communicate with each other through synapses. Damage to neurons can result in loss of sensation, motor function, or cognitive abilities.
There are approximately 30 trillion human cells (with our DNA) and 38 trillion bacterial cells (microbiome) in the average adult human body. Red blood cells make up about 84% of all human cells.
Injury Modes
| Human Body System | Common Injury Modes |
|---|---|
| Muscular, skeletal | Slips, trips, falls, heavy or awkward lifting of objects, falling objects, machine crushing or cutting, high-speed or high-energy debris, blast or pressure waves, or blast fragment |
| Integumentary (skin, ears, eyes) | Cuts, thermal burns, chemical burns, noise, damage to eyes |
| Nervous, circulatory, digestive, respiratory, excretory, endocrine, reproductive, lymphatic, microbiome | Chemical interactions upon absorption through the skin, inhalation, ingestion, or injection |
Chemical Lethality
import numpy as np; import pandas as pd
import matplotlib.pyplot as plt
from scipy.optimize import curve_fit
from scipy.stats import norm
#create a dataframe with the data
df = pd.DataFrame([100,200,275, 400,800], columns=['Dose (mg/kg)'])
df['Fraction (Death)'] = [0/6,1/6,2/6,4/6,6/6]
#set function for fitting with curve_fit
def cumulative_gaussian(x, mu, sigma):
    return norm.cdf(x, mu, sigma)
# fit a cumulative gaussian to the data
popt, pcov = curve_fit(cumulative_gaussian, df['Dose (mg/kg)'], df['Fraction (Death)'],p0=[350, 100])

x = np.linspace(0, 800, 100)
y = cumulative_gaussian(x, *popt)
#plot the data and the fit
df.plot(x='Dose (mg/kg)', y='Fraction (Death)', kind='scatter')
plt.plot(x, y, label='fit'); plt.grid()
plt.show()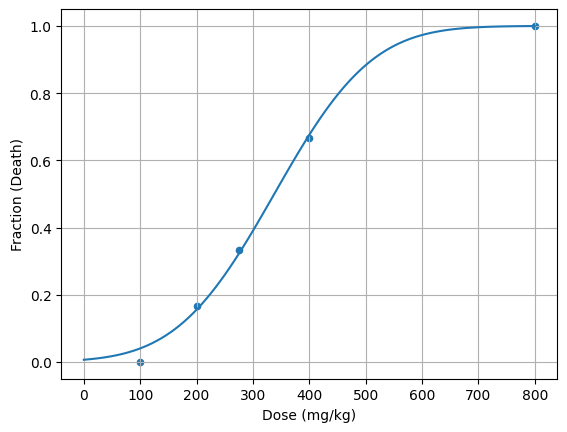
Probit and Logarithmic Dose-Response Models
The probit model is commonly used in toxicology to describe the relationship between the dose of a chemical and the probability of a specific response, such as lethality. The probit function transforms the cumulative distribution function (CDF) of a standard normal distribution into a linear form, allowing for easier analysis of dose-response relationships.
Y = scipy.stats.norm.ppf() + 5
where ( Y ) is the probit value, and ( f ) is the fraction of the population affected (e.g., lethality rate).
from scipy import stats
#plot the probit function for a given range of probabilities
p = np.linspace(0.001, 0.999, 1000)
Y = norm.ppf(p) + 5
# plot of the probit function
plt.plot(p, Y)
plt.xlabel('Probability')
plt.ylabel('Probit Value')
plt.title('Probit Function')
plt.grid()
plt.show()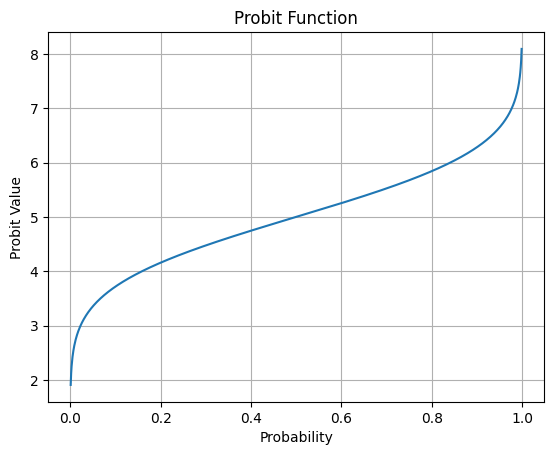
You can linearize the dose-response relationship using the probit function, which helps in estimating lethal doses (e.g., LD50, LD10) based on observed data.
First take the natural log of the dose values.
Then calculate the probit values for the corresponding lethality rates.
Plot the probit values against the log-transformed dose values.
# example linearization of dose-response data using the probit model
# log-transform the dose values
df['Log Dose'] = np.log(df['Dose (mg/kg)'])
# calculate the probit values for the lethality rates
df['Probit'] = norm.ppf(df['Fraction (Death)']) + 5
# plot the probit values against the log-transformed dose values
plt.scatter(df['Log Dose'], df['Probit'])
# fit a line to the probit vs log dose data
dfn = df[1:-1]  # exclude first and last points for fitting
slope, intercept = np.polyfit(dfn['Log Dose'], dfn['Probit'], 1)
# plot the fitted line
xfit = np.linspace(df['Log Dose'].min(), df['Log Dose'].max(), 100)
yfit = slope * xfit + intercept
plt.plot(xfit, yfit, color='red', label='Fitted Line')
plt.xlabel('Log Dose (mg/kg)')
plt.ylabel('Probit Value')
plt.title('Probit vs Log Dose')
plt.grid()
plt.show()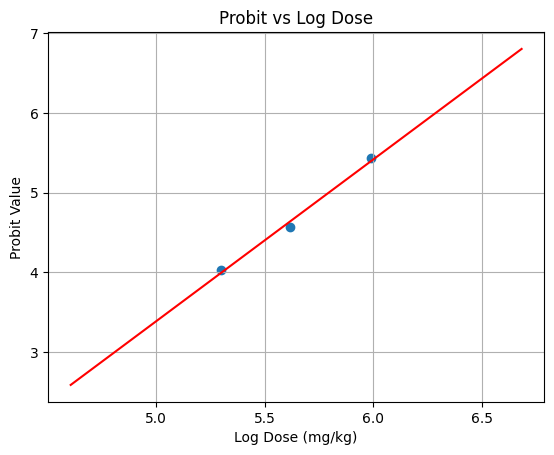
slope, intercept(2.0253297407194766, -6.736255397661254)You can also move backwards from probit value to the dose using the inverse of the probit function. See the above Probit vs probability and rotate it 90 degrees.
The slope and intercept values can be used to define the non-linear relationship between dose and response. Some people have done this for multiple chemicals and have also applied it to other injury modes like heat flux (instead of dose the have used a product of the exposure time and the radiation intensity, see Table 2-5 of Crowl and Louvar’s “Chemical Process Safety”).
What is another way you could define the dose-response relationship with only two parameters?
Possible test question: I give you a probit slope and intercept as well as a dose value, can you calculate the expected lethality rate?
Thought Experiment - Rolling Dice
Roll two dice with the following criteria and plot the results:
Roll the dice 5 times and count how many times you get a sum less than 3
Roll the dice 5 times and count how many times you get a sum of 3 to 5
Roll the dice 5 times and count how many times you get a sum 5 to 12
Plot the cumulative results.
import random
import matplotlib.pyplot as plt
import numpy as np
from scipy.stats import norm
num_rolls = 1000count_2 = 0 # Sum <= 2
count_3_to_5 = 0 # 3 <= Sum <= 5
count_6_to_12 = 0 # 6 <= Sum <= 12
for _ in range(num_rolls):
total_sum = random.randint(1, 6) + random.randint(1, 6)
if total_sum < 3:
count_2 += 1
elif 3 <= total_sum <= 5:
count_3_to_5 += 1
elif 6 <= total_sum <= 12:
count_6_to_12 += 1
# --- 2. Process Data for Dose-Response Plot ---
# The "Dose" is the upper limit of our sum ranges
doses = [2, 5, 12]
# Calculate Cumulative Fractions (accumulating the counts)
cum_fraction_1 = count_2 / num_rolls
cum_fraction_2 = (count_2 + count_3_to_5) / num_rolls
cum_fraction_3 = (count_2 + count_3_to_5 + count_6_to_12) / num_rolls
simulated_probs = [cum_fraction_1, cum_fraction_2, cum_fraction_3]
print(simulated_probs)[0.029, 0.299, 1.0]
mu = 7 #average of 2 dice
sigma = np.sqrt(5.833)  # Variance of 2 dice is ~5.833

# Generate smooth line data
x_theoretical = np.linspace(1, 13, 200)
y_theoretical = norm.cdf(x_theoretical, loc=mu, scale=sigma)


plt.figure(figsize=(10, 6))
plt.plot(x_theoretical, y_theoretical, linewidth=2,
            label='Theoretical Normal CDF') # Plot the Theoretical Normal CDF (The Curve)

plt.plot(doses, simulated_probs, 'o', markersize=9,
            label='Simulated Cumulative Sums') # Plot the Simulated Data (The "Dose" Points)

# Formatting
plt.title('Dice Sums as Dose-Response vs. Normal Distribution', fontsize=14)
plt.xlabel('Sum Threshold (Dose)', fontsize=12)
plt.ylabel('Cumulative Probability', fontsize=12)
plt.legend()
plt.grid(True, alpha=0.3)
plt.xticks(range(2, 13))
plt.ylim(0, 1.05)

plt.show()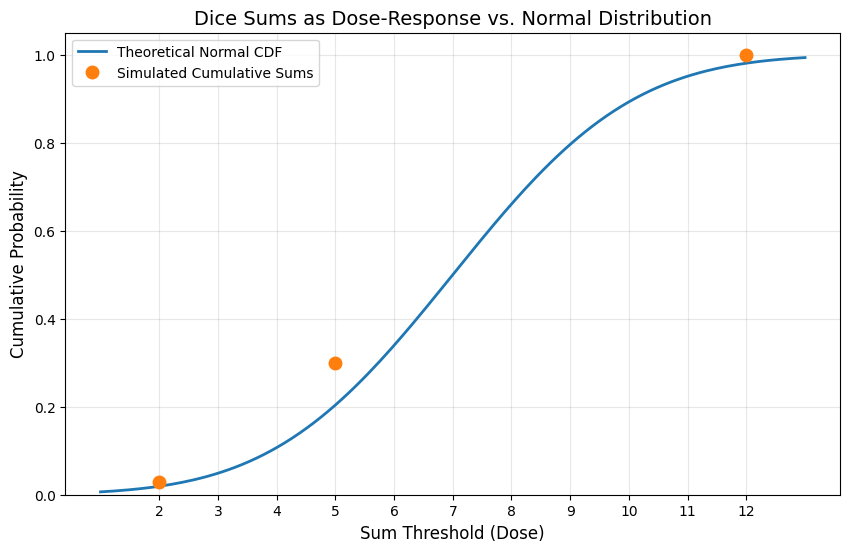
Probability of 0 or 1?
In the above examples, some of the probability were either zero (0 of 6) or one (6 of 6). This can be problematic when trying to fit a dose-response curve, as the probit function is undefined for probabilities of exactly 0 or 1. One option that has been used is to use the binomial distribution:
In the case of 0 of 6, you can set k=0 and n=6, and solve for p such that P(X=0) is 0.5. This assumes that for a given probability p, there is a 50% chance of observing 0 successes in 6 trials. Or in other words, the average probability of success is such that half the time you would expect to see no successes in 6 trials. Solving for p gives:
1-0.5**(1/6), 0.5**(1/6)(0.10910128185966073, 0.8908987181403393)In the explosive testing world, the Threshold Initiation Level (TIL) is an important parameter used to describe the sensitivity of explosives to initiation. 20 trials are completed with 0 initiations where at the next highest level, there is at least 1 initiation in 20 trials. The probability of initiation at the TIL level is assumed to be 3.4% based on the binomial distribution approach described above. 1-0.5^(1/20),
1-0.5**(1/20)0.0340636710751544Transient Mass Balance Intro
If I have to go to the hospital and they give me an IV for a certain drug, how long to reach a therapeutic dose level (mg/mL) in my bloodstream given the infusion rate (mg/min) and my blood volume (mL)? Assume no elimination.
This is an initial value problem and an ordinary differential equation (ODE) that can be solved with integration. It is a transient mass balance on the bloodstream volume. It is a relatively simple problem that can be solved analytically or numerically.
accumulation = in - out + generation - consumption